Cell Text Fidelity
The page and OCR disagree—which should the parser trust?
✅ NormativeSettled. The requirement holds as written.📄 Page ruleCan be applied from the page alone.Read §9.6.3 in the RFC ↗
The text of a cell MUST be what the rendered page shows — not the text layer, not OCR, and not
what the value ought to be. A character that cannot be read at any zoom MUST be written as
[illegible], never as a plausible guess.
When it applies
The text layer and the rendered image disagree at the character level far more often than expected, and the cost of a single wrong digit depends entirely on who reads the table. The text layer is a hint about roughly what is there; the image decides.
Reading the examples. Each one pairs a source page with the output the rule expects. ✅ Sample: the rule applies. ❌ Counter-sample: it looks like it applies and does not, or a rendering got it wrong. A non-conforming output, in red, is shown only for contrast. … marks content left out of an excerpt.
Three cells that were read wrong
In each of these the transcription and the OCR agreed with each other — and a zoomed view of the page proved both wrong:
printed 0.99        → transcribed 0.98      (Age-to-Ultimate factor)
printed 2012.5-(A)  → transcribed 2013.5-(A)
printed 1.0400^(W)  → transcribed 1.04009^(W)
A disputed cell SHOULD be settled from a zoomed crop of the cell or from the word coordinates, and
MUST NOT be settled by plausibility. "Plausible" is exactly what produced all three errors above:
0.98 is a perfectly reasonable factor.
A plausible value substituted for the printed one3samehead
32031.9% for the 2004+
% of Premium cell; the non-conforming output records 10.9%. The wrong value is the believable
one — exactly the failure this rule prevents. The section lines (Issue Year, Issue Age) are
bands across the grid.Source page
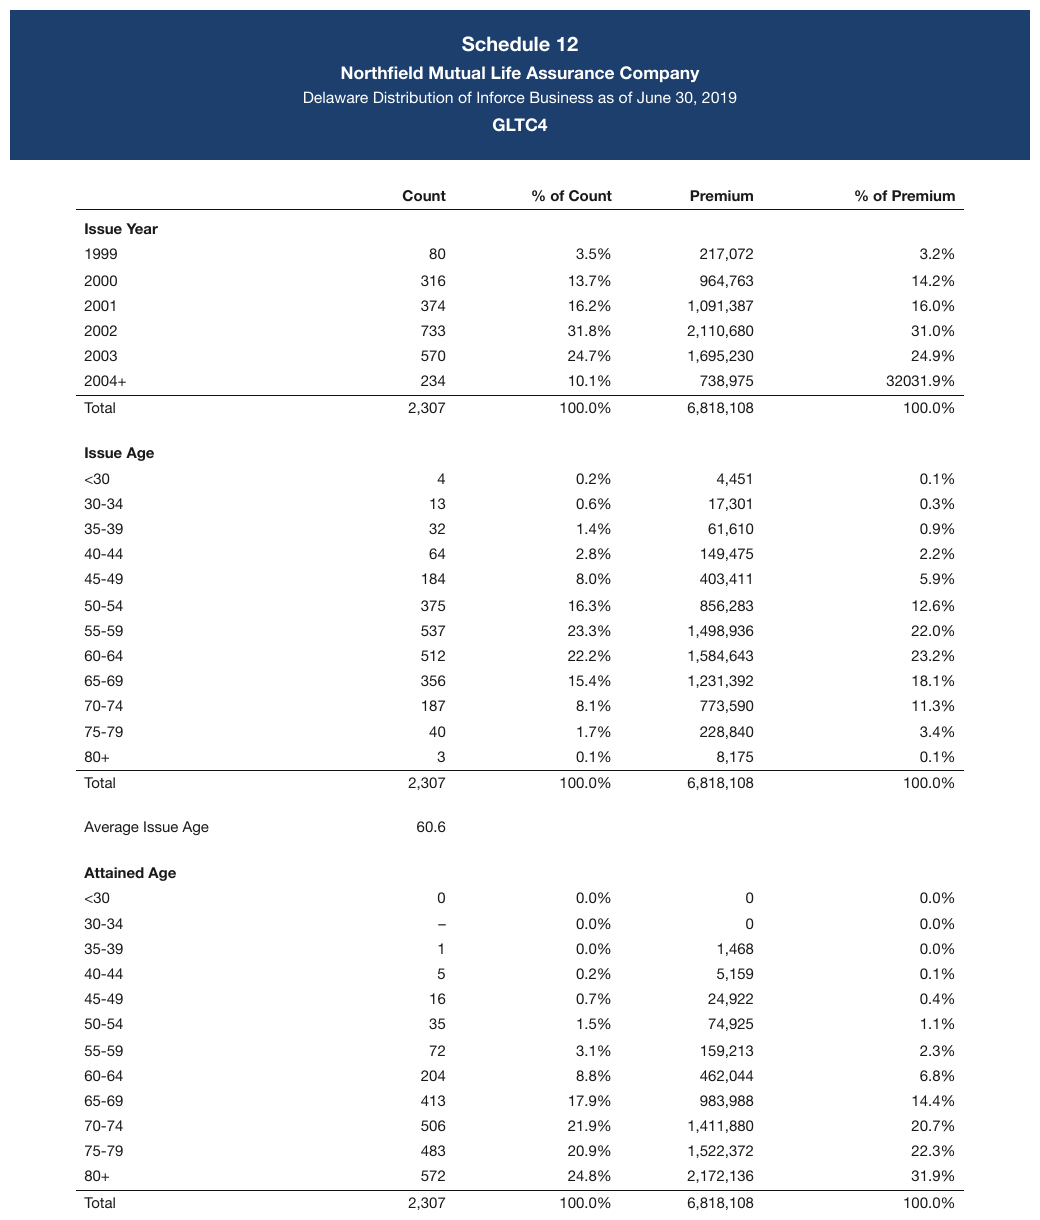
Expected output · excerpt
| Count | % of Count | Premium | % of Premium | |||||||||||||||||||||||||||||||||||||||||||||||||||||||||||||||||||||||||||||||||||||||||||||||
|---|---|---|---|---|---|---|---|---|---|---|---|---|---|---|---|---|---|---|---|---|---|---|---|---|---|---|---|---|---|---|---|---|---|---|---|---|---|---|---|---|---|---|---|---|---|---|---|---|---|---|---|---|---|---|---|---|---|---|---|---|---|---|---|---|---|---|---|---|---|---|---|---|---|---|---|---|---|---|---|---|---|---|---|---|---|---|---|---|---|---|---|---|---|---|---|---|---|---|
| Issue Year | ||||||||||||||||||||||||||||||||||||||||||||||||||||||||||||||||||||||||||||||||||||||||||||||||||
| 1999 | 80 | 3.5% | 217,072 | 3.2% | ||||||||||||||||||||||||||||||||||||||||||||||||||||||||||||||||||||||||||||||||||||||||||||||
| 2000 | 316 | 13.7% | 964,763 | 14.2% | ||||||||||||||||||||||||||||||||||||||||||||||||||||||||||||||||||||||||||||||||||||||||||||||
| 2001 | 374 | 16.2% | 1,091,387 | 16.0% | ||||||||||||||||||||||||||||||||||||||||||||||||||||||||||||||||||||||||||||||||||||||||||||||
| 2002 | 733 | 31.8% | 2,110,680 | 31.0% | ||||||||||||||||||||||||||||||||||||||||||||||||||||||||||||||||||||||||||||||||||||||||||||||
| 2003 | 570 | 24.7% | 1,695,230 | 24.9% | ||||||||||||||||||||||||||||||||||||||||||||||||||||||||||||||||||||||||||||||||||||||||||||||
| 2004+ | 234 | 10.1% | 738,975 | 32031.9% | ||||||||||||||||||||||||||||||||||||||||||||||||||||||||||||||||||||||||||||||||||||||||||||||
| Total | 2,307 | 100.0% | 6,818,108 | 100.0% | ||||||||||||||||||||||||||||||||||||||||||||||||||||||||||||||||||||||||||||||||||||||||||||||
| Issue Age | ||||||||||||||||||||||||||||||||||||||||||||||||||||||||||||||||||||||||||||||||||||||||||||||||||
| <30 | 4 | 0.2% | 4,451 | 0.1% | ||||||||||||||||||||||||||||||||||||||||||||||||||||||||||||||||||||||||||||||||||||||||||||||
| 30-34 | 13 | 0.6% | 17,301 | 0.3% | ||||||||||||||||||||||||||||||||||||||||||||||||||||||||||||||||||||||||||||||||||||||||||||||
| … | ||||||||||||||||||||||||||||||||||||||||||||||||||||||||||||||||||||||||||||||||||||||||||||||||||
Non-conforming output
What the rule rules out.
| Count | % of Count | Premium | % of Premium | |||||||||||||||||||||||||||||||||||||||||||||||||||||||||||||||||||||||||||||||||||||||||||||||
|---|---|---|---|---|---|---|---|---|---|---|---|---|---|---|---|---|---|---|---|---|---|---|---|---|---|---|---|---|---|---|---|---|---|---|---|---|---|---|---|---|---|---|---|---|---|---|---|---|---|---|---|---|---|---|---|---|---|---|---|---|---|---|---|---|---|---|---|---|---|---|---|---|---|---|---|---|---|---|---|---|---|---|---|---|---|---|---|---|---|---|---|---|---|---|---|---|---|---|
| Issue Year | ||||||||||||||||||||||||||||||||||||||||||||||||||||||||||||||||||||||||||||||||||||||||||||||||||
| … | ||||||||||||||||||||||||||||||||||||||||||||||||||||||||||||||||||||||||||||||||||||||||||||||||||
| 2003 | 570 | 24.7% | 1,695,230 | 24.9% | ||||||||||||||||||||||||||||||||||||||||||||||||||||||||||||||||||||||||||||||||||||||||||||||
| 2004+ | 234 | 10.1% | 738,975 | 10.9% | ||||||||||||||||||||||||||||||||||||||||||||||||||||||||||||||||||||||||||||||||||||||||||||||
| Total | 2,307 | 100.0% | 6,818,108 | 100.0% | ||||||||||||||||||||||||||||||||||||||||||||||||||||||||||||||||||||||||||||||||||||||||||||||
| Issue Age | ||||||||||||||||||||||||||||||||||||||||||||||||||||||||||||||||||||||||||||||||||||||||||||||||||
| <30 | 4 | 0.2% | 4,451 | 0.1% | ||||||||||||||||||||||||||||||||||||||||||||||||||||||||||||||||||||||||||||||||||||||||||||||
| 30-34 | 13 | 0.6% | 17,301 | 0.3% | ||||||||||||||||||||||||||||||||||||||||||||||||||||||||||||||||||||||||||||||||||||||||||||||
| … | ||||||||||||||||||||||||||||||||||||||||||||||||||||||||||||||||||||||||||||||||||||||||||||||||||
What is printed is what is written
- Typos stay. A word misspelled inside a cell MUST keep its misspelling.
- Numbers are copied digit by digit, with thousands and decimal separators exactly as printed. See Accounting Number Formats (§9.6.1).
- Wrapped codes are not fused with their neighbours. In a narrow column a code can wrap onto two
lines, or two short codes can sit in neighbouring cells and look like one. The column boundaries
and the cell's span decide: fusing
B-2withVC, orTR-1withTR-2, is an error, and it also throws off the column count of the whole row. - A blank cell stays empty. A cell that prints nothing MUST be rendered empty; a dash MUST NOT be supplied because the column has dashes elsewhere.
The page prints 2.5 for the KVO shareholder TWh figure3cc
the non-conforming output records 25
— a dropped decimal point, silently. Renewable and Nuclear below it are indented one step; the
total row is bold.
Source page
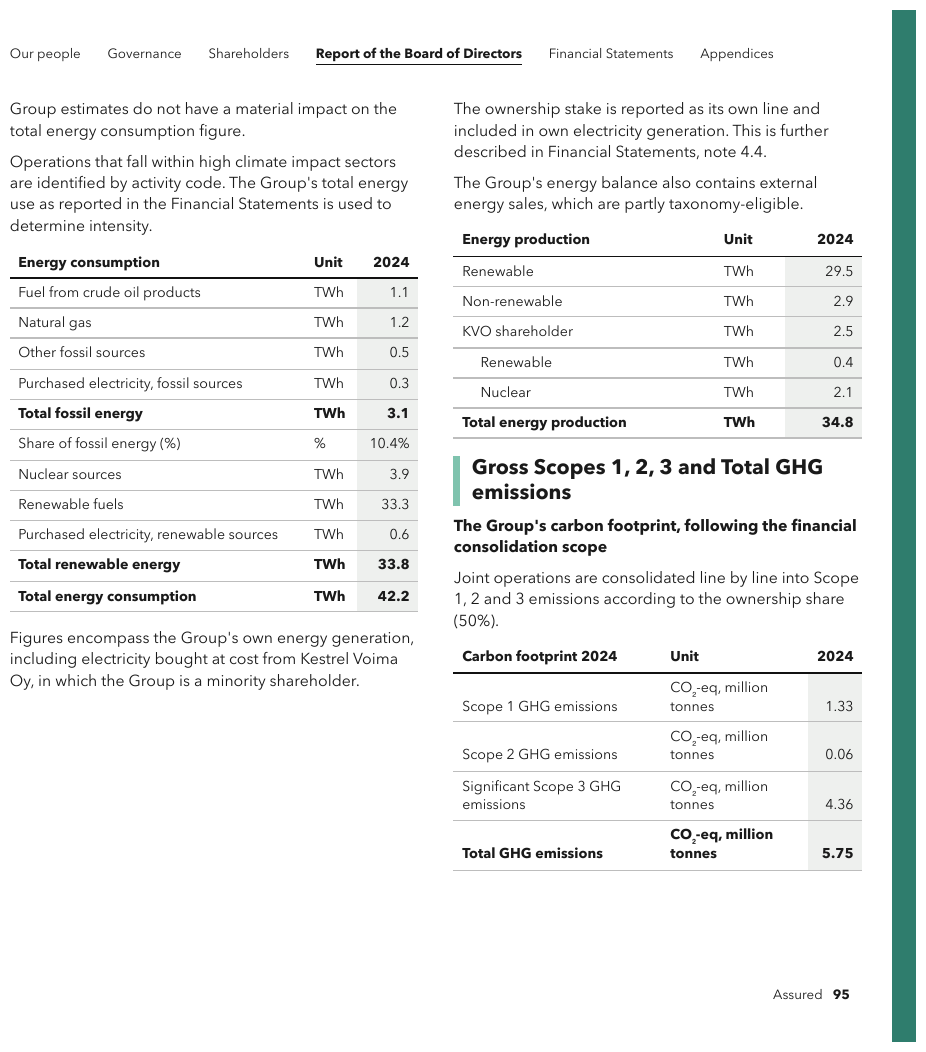
Expected output · table 2 of 3
| Energy production | Unit | 2024 |
|---|---|---|
| Renewable | TWh | 29.5 |
| Non-renewable | TWh | 2.9 |
| KVO shareholder | TWh | 2.5 |
| Renewable | TWh | 0.4 |
| Nuclear | TWh | 2.1 |
| Total energy production | TWh | 34.8 |
Non-conforming output
What the rule rules out.
| Energy production | Unit | 2024 | ||||||||||||||||||||||||||||||||||||||||||||||||||||||||||||||||||||||||||||||||||||||||||||||||
|---|---|---|---|---|---|---|---|---|---|---|---|---|---|---|---|---|---|---|---|---|---|---|---|---|---|---|---|---|---|---|---|---|---|---|---|---|---|---|---|---|---|---|---|---|---|---|---|---|---|---|---|---|---|---|---|---|---|---|---|---|---|---|---|---|---|---|---|---|---|---|---|---|---|---|---|---|---|---|---|---|---|---|---|---|---|---|---|---|---|---|---|---|---|---|---|---|---|---|
| … | ||||||||||||||||||||||||||||||||||||||||||||||||||||||||||||||||||||||||||||||||||||||||||||||||||
| Non-renewable | TWh | 2.9 | ||||||||||||||||||||||||||||||||||||||||||||||||||||||||||||||||||||||||||||||||||||||||||||||||
| KVO shareholder | TWh | 25 | ||||||||||||||||||||||||||||||||||||||||||||||||||||||||||||||||||||||||||||||||||||||||||||||||
| Renewable | TWh | 0.4 | ||||||||||||||||||||||||||||||||||||||||||||||||||||||||||||||||||||||||||||||||||||||||||||||||
| Nuclear | TWh | 2.1 | ||||||||||||||||||||||||||||||||||||||||||||||||||||||||||||||||||||||||||||||||||||||||||||||||
| Total energy production | TWh | 34.8 | ||||||||||||||||||||||||||||||||||||||||||||||||||||||||||||||||||||||||||||||||||||||||||||||||
The reverse errorentwick
in the Rückkauf eigener Anteile row the Eigene Anteile cell is printed blank, and the non-conforming output invents an em dash for it.
Source page
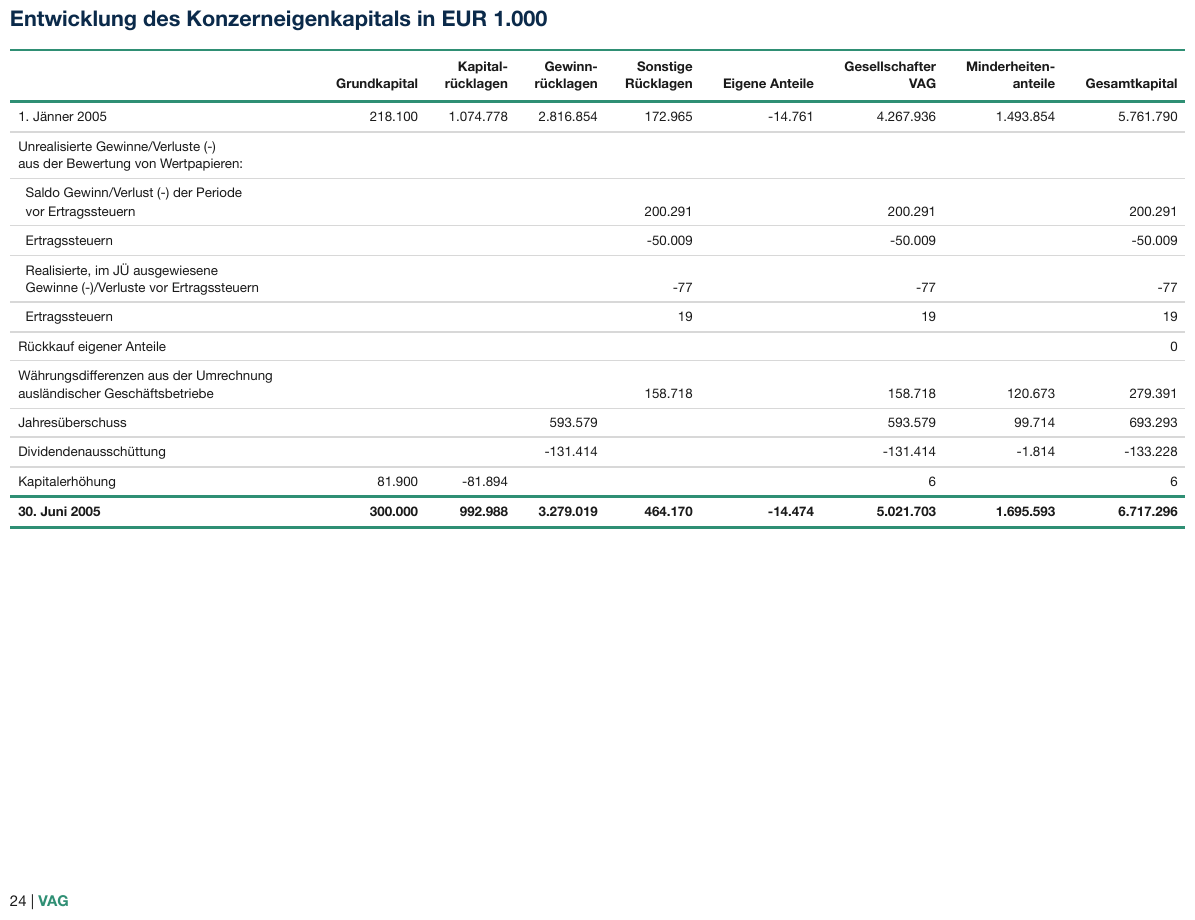
Expected output · excerpt
| Grundkapital | Kapitalrücklagen | Gewinnrücklagen | Sonstige Rücklagen | Eigene Anteile | Gesellschafter VAG | Minderheitenanteile | Gesamtkapital | |||||||||||||||||||||||||||||||||||||||||||||||||||||||||||||||||||||||||||||||||||||||||||
|---|---|---|---|---|---|---|---|---|---|---|---|---|---|---|---|---|---|---|---|---|---|---|---|---|---|---|---|---|---|---|---|---|---|---|---|---|---|---|---|---|---|---|---|---|---|---|---|---|---|---|---|---|---|---|---|---|---|---|---|---|---|---|---|---|---|---|---|---|---|---|---|---|---|---|---|---|---|---|---|---|---|---|---|---|---|---|---|---|---|---|---|---|---|---|---|---|---|---|
| 1. Jänner 2005 | 218.100 | 1.074.778 | 2.816.854 | 172.965 | -14.761 | 4.267.936 | 1.493.854 | 5.761.790 | ||||||||||||||||||||||||||||||||||||||||||||||||||||||||||||||||||||||||||||||||||||||||||
| Unrealisierte Gewinne/Verluste (-) aus der Bewertung von Wertpapieren: | ||||||||||||||||||||||||||||||||||||||||||||||||||||||||||||||||||||||||||||||||||||||||||||||||||
| Saldo Gewinn/Verlust (-) der Periode vor Ertragssteuern | 200.291 | 200.291 | 200.291 | |||||||||||||||||||||||||||||||||||||||||||||||||||||||||||||||||||||||||||||||||||||||||||||||
| Ertragssteuern | -50.009 | -50.009 | -50.009 | |||||||||||||||||||||||||||||||||||||||||||||||||||||||||||||||||||||||||||||||||||||||||||||||
| Realisierte, im JÜ ausgewiesene Gewinne (-)/Verluste vor Ertragssteuern | -77 | -77 | -77 | |||||||||||||||||||||||||||||||||||||||||||||||||||||||||||||||||||||||||||||||||||||||||||||||
| Ertragssteuern | 19 | 19 | 19 | |||||||||||||||||||||||||||||||||||||||||||||||||||||||||||||||||||||||||||||||||||||||||||||||
| Rückkauf eigener Anteile | 0 | |||||||||||||||||||||||||||||||||||||||||||||||||||||||||||||||||||||||||||||||||||||||||||||||||
| … | ||||||||||||||||||||||||||||||||||||||||||||||||||||||||||||||||||||||||||||||||||||||||||||||||||
Non-conforming output
What the rule rules out.
| Grundkapital | Kapital- rücklagen | Gewinn- rücklagen | Sonstige Rücklagen | Eigene Anteile | Gesellschafter VAG | Minderheiten- anteile | Gesamtkapital | |||||||||||||||||||||||||||||||||||||||||||||||||||||||||||||||||||||||||||||||||||||||||||
|---|---|---|---|---|---|---|---|---|---|---|---|---|---|---|---|---|---|---|---|---|---|---|---|---|---|---|---|---|---|---|---|---|---|---|---|---|---|---|---|---|---|---|---|---|---|---|---|---|---|---|---|---|---|---|---|---|---|---|---|---|---|---|---|---|---|---|---|---|---|---|---|---|---|---|---|---|---|---|---|---|---|---|---|---|---|---|---|---|---|---|---|---|---|---|---|---|---|---|
| 1. Jänner 2005 | 218.100 | 1.074.778 | 2.816.854 | 172.965 | -14.761 | 4.267.936 | 1.493.854 | 5.761.790 | ||||||||||||||||||||||||||||||||||||||||||||||||||||||||||||||||||||||||||||||||||||||||||
| Unrealisierte Gewinne/Verluste (-) aus der Bewertung von Wertpapieren: | ||||||||||||||||||||||||||||||||||||||||||||||||||||||||||||||||||||||||||||||||||||||||||||||||||
| Saldo Gewinn/Verlust (-) der Periode vor Ertragssteuern | 200.291 | 200.291 | 200.291 | |||||||||||||||||||||||||||||||||||||||||||||||||||||||||||||||||||||||||||||||||||||||||||||||
| Ertragssteuern | -50.009 | -50.009 | -50.009 | |||||||||||||||||||||||||||||||||||||||||||||||||||||||||||||||||||||||||||||||||||||||||||||||
| Realisierte, im JÜ ausgewiesene Gewinne (-)/Verluste vor Ertragssteuern | -77 | -77 | -77 | |||||||||||||||||||||||||||||||||||||||||||||||||||||||||||||||||||||||||||||||||||||||||||||||
| Ertragssteuern | 19 | 19 | 19 | |||||||||||||||||||||||||||||||||||||||||||||||||||||||||||||||||||||||||||||||||||||||||||||||
| Rückkauf eigener Anteile | — | 0 | ||||||||||||||||||||||||||||||||||||||||||||||||||||||||||||||||||||||||||||||||||||||||||||||||
| … | ||||||||||||||||||||||||||||||||||||||||||||||||||||||||||||||||||||||||||||||||||||||||||||||||||
Characters the image cannot tell apart
Some characters are visually identical and no zoom separates them: µ (U+00B5) and μ (U+03BC), a non-breaking space and an ordinary space, a minus sign and a hyphen.
- The output MUST keep the visible form and the character count exactly as printed, and SHOULD use the character normally typed for that glyph.
- The text layer MUST NOT be used to break the tie: it is a hint about the content, never the authority on it.
- A consumer or checker MUST treat the members of each family below as equal, so the choice among them cannot make an output non-conforming.
| Family | Written as |
|---|---|
| µ (U+00B5) ≡ μ (U+03BC) | either |
| non-breaking space ≡ ordinary space | an ordinary space |
| minus sign (U+2212) ≡ hyphen-minus | - |
| non-breaking hyphen ≡ hyphen-minus | - |
| figure dash, en dash ≡ hyphen, inside a numeric range | either |
The image outranks every other source on what is printed. Where two codepoints are indistinguishable there is no fact about the page for it to be authoritative over — µ and μ are the same ink. The visible form is fidelity and stays exact; the codepoint underneath is a serialisation detail.
A dash that is doing something is not a homoglyph question. An em dash alone in a cell is a value — see Marks and Symbols in Cells (§9.6.6) — and a struck-through digit is not a character variant at all.
a true minus sign
−742 and −2,710 are set with a true minus sign rather than a hyphen, beside — for nil. The
minus sign is written as the hyphen-minus -; the em dashes stay em dashes. The header cells are
genuinely merged across two rows and wrapped labels are joined; the Net Sales and Other Items
bands are bold where the headings are not.
Source page
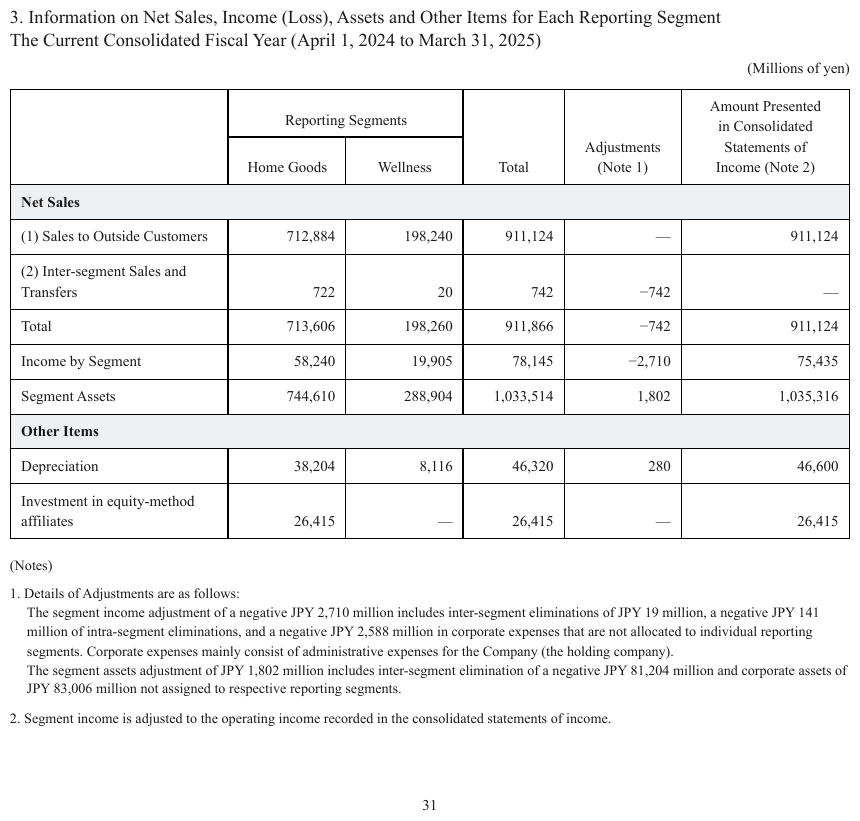
Expected output
| Reporting Segments | Total | Adjustments (Note 1) | Amount Presented in Consolidated Statements of Income (Note 2) | ||
|---|---|---|---|---|---|
| Home Goods | Wellness | ||||
| Net Sales | |||||
| (1) Sales to Outside Customers | 712,884 | 198,240 | 911,124 | — | 911,124 |
| (2) Inter-segment Sales and Transfers | 722 | 20 | 742 | -742 | — |
| Total | 713,606 | 198,260 | 911,866 | -742 | 911,124 |
| Income by Segment | 58,240 | 19,905 | 78,145 | -2,710 | 75,435 |
| Segment Assets | 744,610 | 288,904 | 1,033,514 | 1,802 | 1,035,316 |
| Other Items | |||||
| Depreciation | 38,204 | 8,116 | 46,320 | 280 | 46,600 |
| Investment in equity-method affiliates | 26,415 | — | 26,415 | — | 26,415 |
What else rests on the image
- Duplicated Tables (§9.2.4) — the rendered page decides whether a repeated table is really printed twice.
- Struck and Replaced Values (§9.6.7) — OCR silently joins a struck value to its replacement and produces a number that appears nowhere on the page. Only the image catches it.
Look-alike
Two similar pages that call for different decisions. Synthetic, for teaching the boundary.
A cell with no number in it. Is there a value, or nothing?
An em-dash alone
| 5-yr | 15-yr | |
|---|---|---|
| Timber | 2.66 | 3.82 |
| Real estate | -0.87 | — |
A value. Record the dash.
A genuinely blank cell
| 2005 | 2004 | |
|---|---|---|
| Ertragssteuern | -50.009 | -50.009 |
| Unrealisierte |
Empty. Never supply a dash.
Look at the structure. What evidence changes the answer?
Neighbouring rules, and how they differ
More
Rule id tables-cell-text-fidelity · tables fidelity ocr