Values and Tolerances
A chart value—copy a printed number or estimate the mark?
✅ NormativeSettled. The requirement holds as written.📄 Page ruleCan be applied from the page alone.Read §11.1.4 in the RFC ↗
Each cell of a chart table holds one of three values. A value printed on the chart MUST be
copied character for character and in full. A value not printed MUST be estimated at the
mark's visual centre against the mark's own axis. A mark drawn at the baseline, or a labeled
position with no mark, MUST be 0.
Reading the examples. Each one pairs a source page with the output the rule expects. ✅ Sample: the rule applies. ❌ Counter-sample: it looks like it applies and does not, or a rendering got it wrong. A non-conforming output, in red, is shown only for contrast. … marks content left out of an excerpt.
Printed values — copied exactly
Whatever the chart prints at, on or beside the mark is the value, in full:
25 (13.0%)stays25 (13.0%)— not25, not13.0%, and never25 countries (13.0%);- printed formats stay: thousands separators (
11,270), decimal commas (2,08), currency and percent marks, parentheses for negatives (($60B)), footnote markers (<sup>1,2</sup>3.60); - printed beats geometry: where the label says
43, the value is43even if the bar top measures a hair lower.
Estimated values — the visual centre
Where nothing is printed, the value is read at the mark's visual centre against its own axis — a second axis where the series is scaled by one (see Dual-Axis and Combo Charts (§11.2.2)), the decade bands of a logarithmic axis (see Log Scale Charts (§11.2.6)), and a stacked segment's own two boundaries (see Stacked Bars and Waterfalls (§11.2.9)).
An estimate SHOULD be a value a careful reader could defend within the readability tolerance below — neither falsely precise nor coarser than the axis allows.
How an estimated value is written. An estimated value MUST be written as a bare number in the
axis's own format — its unit mark (2.5% on a percent axis) and its digit grouping (17 000 on an
axis ticked 18 000) — with no approximation marker, and no more precise than the reading
supports: at most one decimal place beyond the axis's tick labels, and two significant figures on a
logarithmic axis. Whether a value was printed or estimated is recoverable from the page and is not
marked in the Markdown.
Zeros
A mark drawn at the baseline is 0. A labeled position with no mark at all is also 0 —
the histogram's empty 1500 bin is 0 (see Bars and Histograms (§11.2.1)). A stack that simply has no
segment of one series leaves that cell empty instead (see Stacked Bars and Waterfalls (§11.2.9)).
Bars drawn in perspective
A printed bar value is copied first. Otherwise the value-bearing edge is read against the corresponding axis plane, excluding perspective depth. Where the reference plane is ambiguous, the value is the midpoint of the plausible readings.
How a checker compares values
A checker compares each cell with the value it reads off the page:
- Printed value — the same number, compared exactly. Formatting variants of the same number (thousands separators, decimal comma or point, currency and percent marks) MAY be treated as equal; a different number is wrong.
- Estimated value — accepted within a relative tolerance of the checker's own reading, chosen by how readable the mark is:
| How readable is the mark? | Relative tolerance |
|---|---|
| Sits on a gridline | 0.05 |
| Between gridlines, judgeable | 0.1 |
| Small, dense, or unclear scale | 0.15 – 0.2 |
| Near zero, where a relative band is too narrow | wider, as the reading demands (a -1 read on a 10-unit grid takes 0.3) |
Most estimates fall between 0.05 and 0.15, and a tolerance above 0.2 is exceptional. The tolerance is the range a careful eye can defend: not so tight that a second careful reading fails it, not so loose that a wrong reading passes. For bars drawn in perspective it is widened to cover every plausible reading.
One series, twelve barshealth-workforce-2024_p46
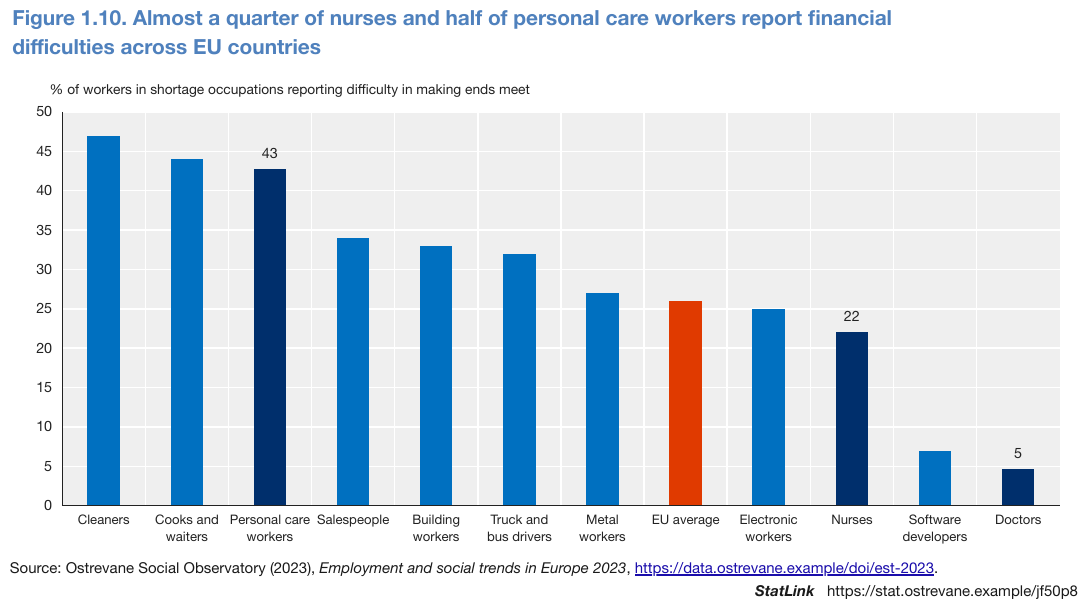
Three bars print their number (43, 22, 5) and are copied exactly;
the other nine are estimates against the 5-unit grid, most on or near a gridline (tolerance 0.05),
the small Software developers bar harder to judge (0.1). Doctors stays 5 although its bar top
measures a touch lower. The red EU average bar is an ordinary row: highlighting is styling, not
structure. The single series has no printed name, so its column is headed by the value-axis title.
Source page
Expected output
| % of workers in shortage occupations reporting difficulty in making ends meet | |
|---|---|
| Cleaners | 47 |
| Cooks and waiters | 44 |
| Personal care workers | 43 |
| Salespeople | 34 |
| Building workers | 33 |
| Truck and bus drivers | 32 |
| Metal workers | 27 |
| EU average | 26 |
| Electronic workers | 25 |
| Nurses | 22 |
| Software developers | 7 |
| Doctors | 5 |
Source: Ostrevane Social Observatory (2023), Employment and social trends in Europe 2023, https://data.ostrevane.example/doi/est-2023.
StatLink https://stat.ostrevane.example/jf50p8
bars drawn in perspective
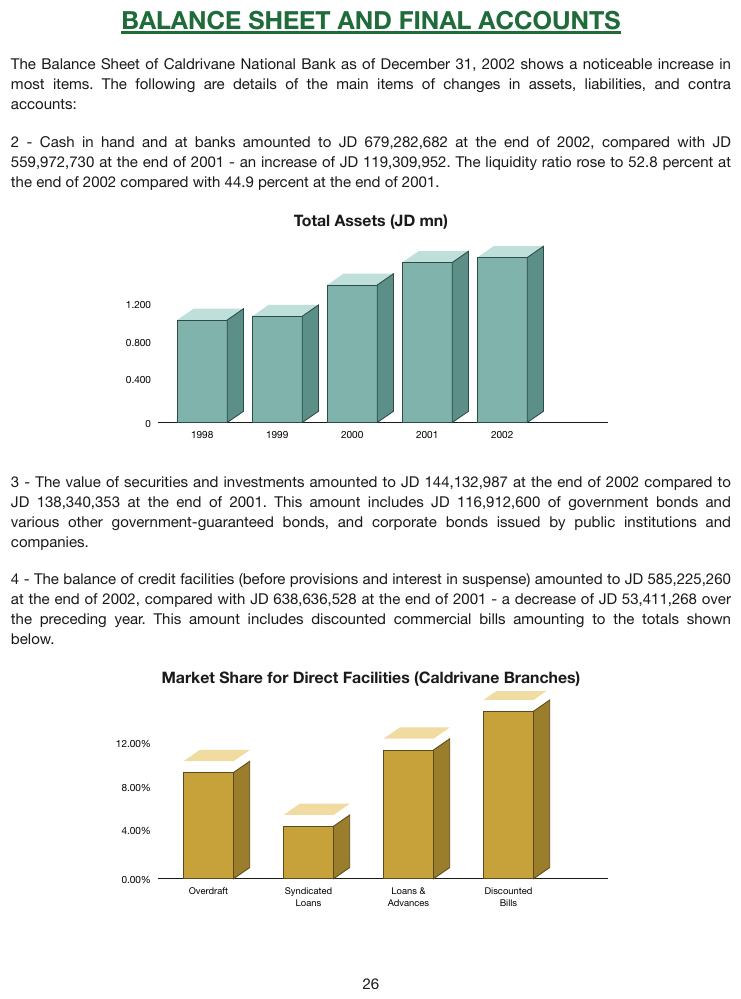
Two 3-D bar charts with no printed values. Each bar has a front top edge and a back top edge at
different heights. The axis ticks and the baseline sit on the front plane, so the front top edge is
the value-bearing edge; every value below is an estimate, read to two significant figures on the
first chart and to a tenth of a percent on the second. The tick labels print 1.200 and 12.00%,
but an estimate is not written to that precision. The paragraphs between and around the charts are
elided.
Source page
Expected output · excerpt, the two charts
…
| 1998 | 1.0 |
| 1999 | 1.1 |
| 2000 | 1.4 |
| 2001 | 1.6 |
| 2002 | 1.7 |
…
| Overdraft | 9.3% |
| Syndicated Loans | 4.5% |
| Loans & Advances | 11.2% |
| Discounted Bills | 14.7% |
…
Look-alike
Two similar pages that call for different decisions. Synthetic, for teaching the boundary.
Two bars in one chart. One prints its number, one does not. Same treatment?
A printed value
Copy it character for character. No tolerance.
An estimated value
Read the mark against its axis; write the estimate as a bare number.
Look at the structure. What evidence changes the answer?
Neighbouring rules, and how they differ
More
Rule id charts-values-and-tolerances · charts values