Side-by-Side Mini Tables
Small tables side by side with aligned rows—one table or several?
✅ NormativeSettled. The requirement holds as written.📄 Page ruleCan be applied from the page alone.Read §9.2.8 in the RFC ↗
Boxes sitting side by side with their own titles and their own schemas MUST be rendered as separate tables — even when their rows line up perfectly. Neighbouring tables MUST NOT be woven together, and a small side table MUST NOT be folded into the middle of another table's body.
When it applies
Printed:  [Box A]      [Box B]        Woven output (non-conforming):
          | a1 | a2 |  | b1 | b2 |    | a1 | a2 | b1 | b2 |
          | a3 | a4 |  | b3 | b4 |    | a3 | a4 | b3 | b4 |
                                        ↑ rows from unrelated boxes glued together
Weaving is not merely mis-structured. It asserts that a1 and b1 belong to the same record,
which the page never said (never invent).
Reading the examples. Each one pairs a source page with the output the rule expects. ✅ Sample: the rule applies. ❌ Counter-sample: it looks like it applies and does not, or a rendering got it wrong. A non-conforming output, in red, is shown only for contrast. … marks content left out of an excerpt.
Requirements
- Each box MUST be rendered as its own table, with its own title and its own header stack.
- Row alignment MUST NOT be used as a grouping signal. Boxes are top-aligned for looks, so their rows land at the same heights by accident.
- The title and the schema decide: its own title and its own columns means its own table.
- A small side table MUST NOT be absorbed into another table's body. A "12pt / 3 Year" side panel is not three extra rows in the claims grid beside it.
Three separately bordered and titled card-count tables, identical schema, distinct data3tables
Each boxed title is the first header row of its own table.
Source page
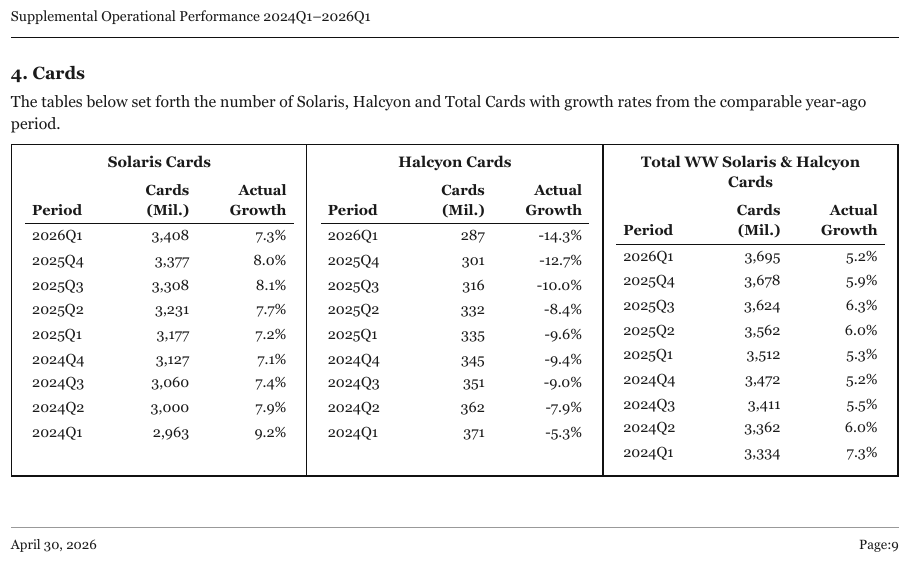
Expected output · table 1 of 3
| Solaris Cards | ||
|---|---|---|
| Period | Cards (Mil.) | Actual Growth |
| 2026Q1 | 3,408 | 7.3% |
| 2025Q4 | 3,377 | 8.0% |
| 2025Q3 | 3,308 | 8.1% |
| 2025Q2 | 3,231 | 7.7% |
| 2025Q1 | 3,177 | 7.2% |
| 2024Q4 | 3,127 | 7.1% |
| 2024Q3 | 3,060 | 7.4% |
| 2024Q2 | 3,000 | 7.9% |
| 2024Q1 | 2,963 | 9.2% |
Three badged panels — DIABETES, OBESITY, RARE DISEASE — same schema, different products3tt
The footnote numbers are printed raised.
Source page
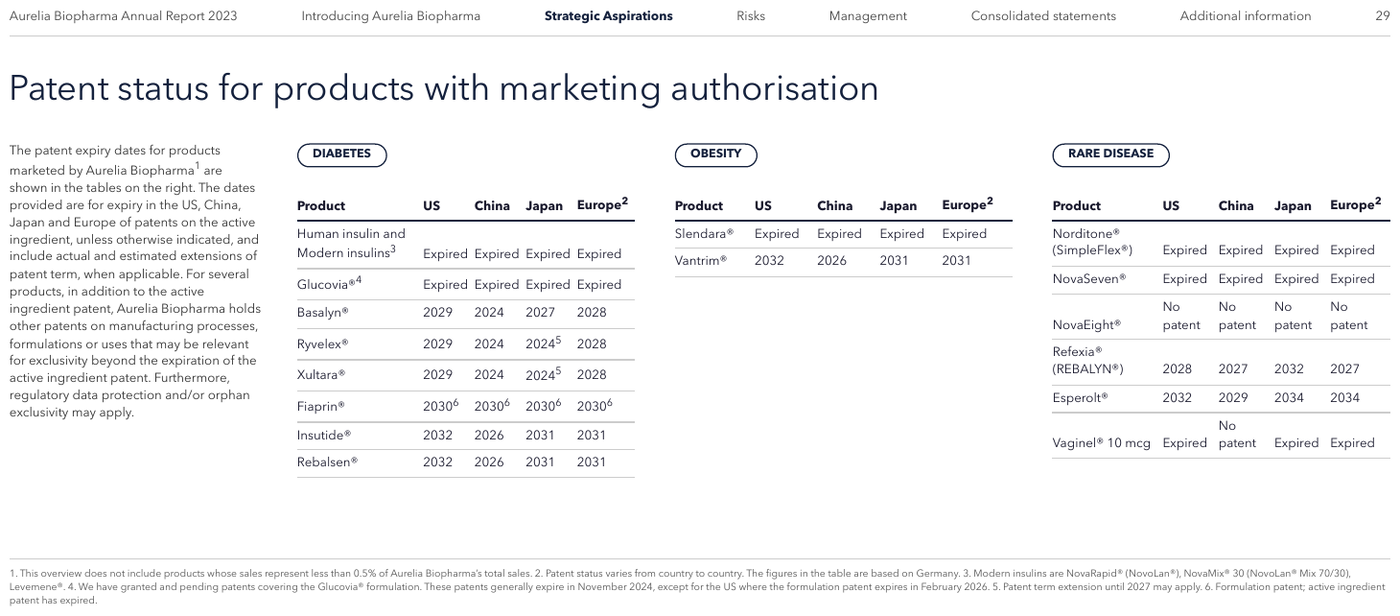
Expected output · excerpt, table 1 of 3
DIABETES
| Product | US | China | Japan | Europe2 |
|---|---|---|---|---|
| Human insulin and Modern insulins3 | Expired | Expired | Expired | Expired |
| Glucovia®4 | Expired | Expired | Expired | Expired |
| Basalyn® | 2029 | 2024 | 2027 | 2028 |
| Ryvelex® | 2029 | 2024 | 20245 | 2028 |
| Xultara® | 2029 | 2024 | 20245 | 2028 |
| Fiaprin® | 20306 | 20306 | 20306 | 20306 |
| Insutide® | 2032 | 2026 | 2031 | 2031 |
| Rebalsen® | 2032 | 2026 | 2031 | 2031 |
OBESITY
…
Two independently framed pet-insurance worksheets (Cat, Dog), rendered as two tables2tt
The blank
gap after Coverage of Exam Fees is left out, and the bold Premium line closes each worksheet.
Source page
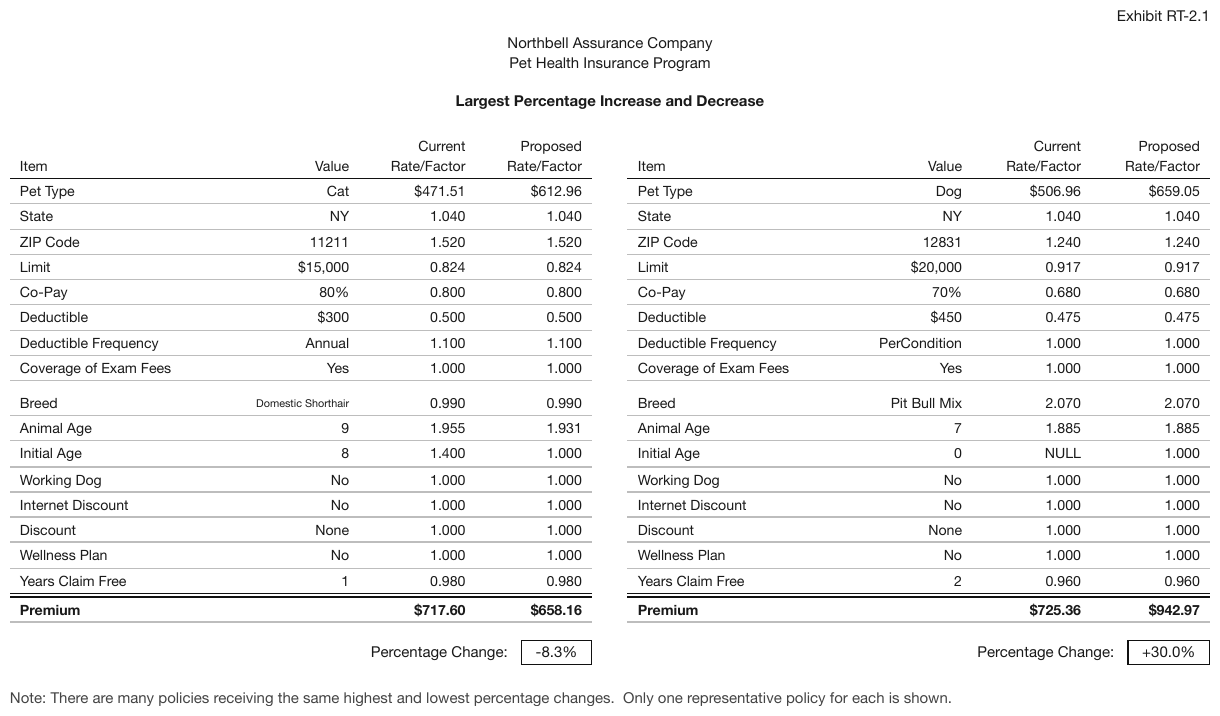
Expected output · table 1 of 2
| Item | Value | Current Rate/Factor | Proposed Rate/Factor |
|---|---|---|---|
| Pet Type | Cat | $471.51 | $612.96 |
| State | NY | 1.040 | 1.040 |
| ZIP Code | 11211 | 1.520 | 1.520 |
| Limit | $15,000 | 0.824 | 0.824 |
| Co-Pay | 80% | 0.800 | 0.800 |
| Deductible | $300 | 0.500 | 0.500 |
| Deductible Frequency | Annual | 1.100 | 1.100 |
| Coverage of Exam Fees | Yes | 1.000 | 1.000 |
| Breed | Domestic Shorthair | 0.990 | 0.990 |
| Animal Age | 9 | 1.955 | 1.931 |
| Initial Age | 8 | 1.400 | 1.000 |
| Working Dog | No | 1.000 | 1.000 |
| Internet Discount | No | 1.000 | 1.000 |
| Discount | None | 1.000 | 1.000 |
| Wellness Plan | No | 1.000 | 1.000 |
| Years Claim Free | 1 | 0.980 | 0.980 |
| Premium | $717.60 | $658.16 |
Percentage Change: -8.3%
Five boxed ACA panels laid out in two rowswaw
Five boxed ACA panels laid out in two rows, each with its own title band and its own full header
stack. The dark band across the top of each panel shares its frame, so it is the first row of that
panel's table. Carrier Cata- / strophic is one wrapped label; the lower panels print
Cata-strophic with the hyphen mid-line, so the hyphen is part of the printed word and is kept.
Source page
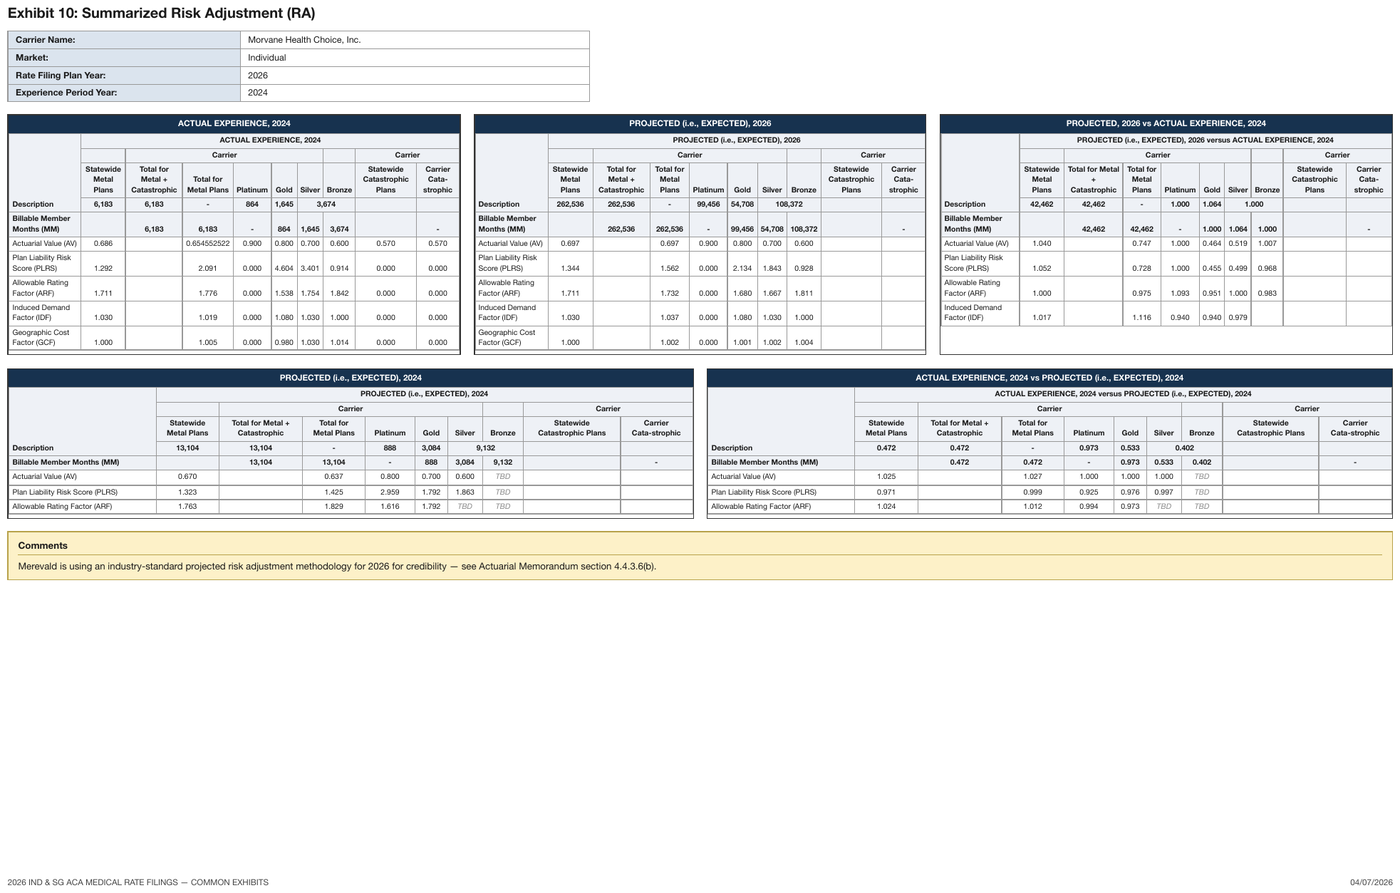
Expected output · table 1 of 5
| ACTUAL EXPERIENCE, 2024 | |||||||||
|---|---|---|---|---|---|---|---|---|---|
| Description | ACTUAL EXPERIENCE, 2024 | ||||||||
| Carrier | Carrier | ||||||||
| Statewide Metal Plans | Total for Metal + Catastrophic | Total for Metal Plans | Platinum | Gold | Silver | Bronze | Statewide Catastrophic Plans | Carrier Cata-strophic | |
| 6,183 | 6,183 | - | 864 | 1,645 | 3,674 | ||||
| Billable Member Months (MM) | 6,183 | 6,183 | - | 864 | 1,645 | 3,674 | - | ||
| Actuarial Value (AV) | 0.686 | 0.654552522 | 0.900 | 0.800 | 0.700 | 0.600 | 0.570 | 0.570 | |
| Plan Liability Risk Score (PLRS) | 1.292 | 2.091 | 0.000 | 4.604 | 3.401 | 0.914 | 0.000 | 0.000 | |
| Allowable Rating Factor (ARF) | 1.711 | 1.776 | 0.000 | 1.538 | 1.754 | 1.842 | 0.000 | 0.000 | |
| Induced Demand Factor (IDF) | 1.030 | 1.019 | 0.000 | 1.080 | 1.030 | 1.000 | 0.000 | 0.000 | |
| Geographic Cost Factor (GCF) | 1.000 | 1.005 | 0.000 | 0.980 | 1.030 | 1.014 | 0.000 | 0.000 | |
Current Rates and Proposed Rates as independently titled boxed pairsstrike
all four blocks are separate tables. Every current rate is struck through.
Source page
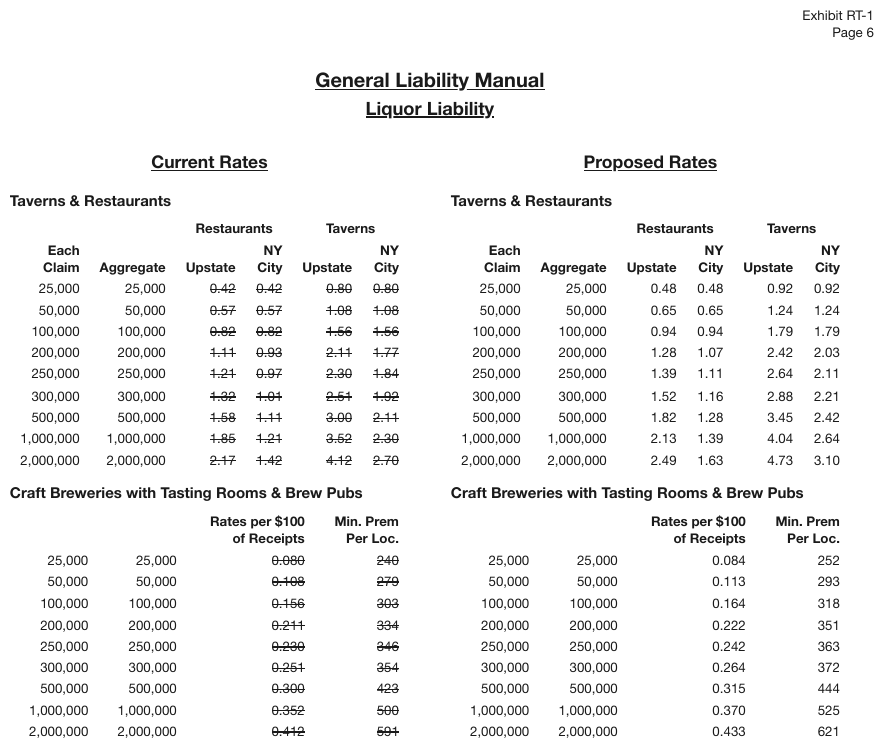
Expected output · excerpt, table 1 of 4
Current Rates
Taverns & Restaurants
| Restaurants | Taverns | ||||
|---|---|---|---|---|---|
| Each Claim | Aggregate | Upstate | NY City | Upstate | NY City |
| 25,000 | 25,000 | ~~0.42~~ | ~~0.42~~ | ~~0.80~~ | ~~0.80~~ |
| 50,000 | 50,000 | ~~0.57~~ | ~~0.57~~ | ~~1.08~~ | ~~1.08~~ |
| 100,000 | 100,000 | ~~0.82~~ | ~~0.82~~ | ~~1.56~~ | ~~1.56~~ |
| 200,000 | 200,000 | ~~1.11~~ | ~~0.93~~ | ~~2.11~~ | ~~1.77~~ |
| 250,000 | 250,000 | ~~1.21~~ | ~~0.97~~ | ~~2.30~~ | ~~1.84~~ |
| 300,000 | 300,000 | ~~1.32~~ | ~~1.01~~ | ~~2.51~~ | ~~1.92~~ |
| 500,000 | 500,000 | ~~1.58~~ | ~~1.11~~ | ~~3.00~~ | ~~2.11~~ |
| 1,000,000 | 1,000,000 | ~~1.85~~ | ~~1.21~~ | ~~3.52~~ | ~~2.30~~ |
| 2,000,000 | 2,000,000 | ~~2.17~~ | ~~1.42~~ | ~~4.12~~ | ~~2.70~~ |
…
The Figure 5 boxed panels look like side-by-side mini-tables but are…figure-cards-p6
The Figure 5 boxed panels look like side-by-side mini-tables but are image-plus-caption cards, not
tabular data: they are rendered as the figure's content in reading order. The only table on the page
is Table 3, whose bold Total row closes it.
Source page
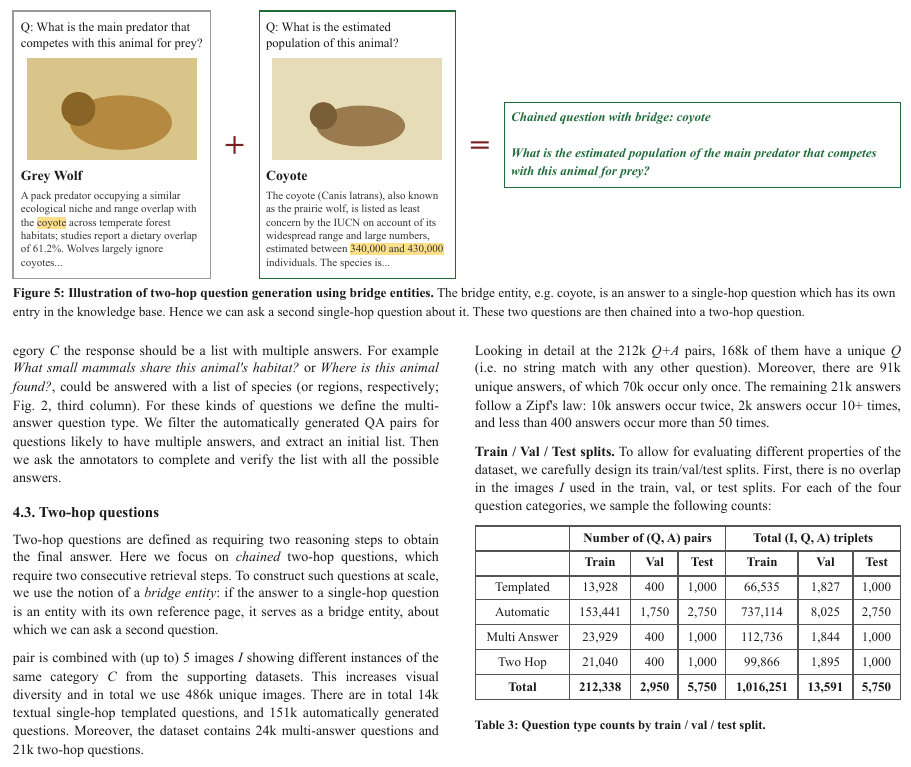
Expected output · excerpt, Figure 5 and Table 3
Q: What is the main predator that competes with this animal for prey?
A flat illustration of an animal: a brown oval body with a darker round head, on a tan background.
Grey Wolf
A pack predator occupying a similar ecological niche and range overlap with the coyote across temperate forest habitats; studies report a dietary overlap of 61.2%. Wolves largely ignore coyotes...
+
Q: What is the estimated population of this animal?
A flat illustration of an animal: a brown oval body with a darker round head, on a pale background.
Coyote
The coyote (Canis latrans), also known as the prairie wolf, is listed as least concern by the IUCN on account of its widespread range and large numbers, estimated between 340,000 and 430,000 individuals. The species is...
=
Chained question with bridge: coyote
What is the estimated population of the main predator that competes with this animal for prey?
Figure 5: Illustration of two-hop question generation using bridge entities. The bridge entity, e.g. coyote, is an answer to a single-hop question which has its own entry in the knowledge base. Hence we can ask a second single-hop question about it. These two questions are then chained into a two-hop question.
…
| Number of (Q, A) pairs | Total (I, Q, A) triplets | |||||
|---|---|---|---|---|---|---|
| Train | Val | Test | Train | Val | Test | |
| Templated | 13,928 | 400 | 1,000 | 66,535 | 1,827 | 1,000 |
| Automatic | 153,441 | 1,750 | 2,750 | 737,114 | 8,025 | 2,750 |
| Multi Answer | 23,929 | 400 | 1,000 | 112,736 | 1,844 | 1,000 |
| Two Hop | 21,040 | 400 | 1,000 | 99,866 | 1,895 | 1,000 |
| Total | 212,338 | 2,950 | 5,750 | 1,016,251 | 13,591 | 5,750 |
Header attribution is per column, not per table
A header owns the columns printed under it, not everything to its right. A title like "Reported Claims" sitting over the claim-count columns does not also claim the year labels beside them. A spanning header MUST span exactly the columns it sits above.
Contrast with the cases that DO merge
The neighbouring cases pull the other way, which is why the title and schema are checked rather than a blanket "boxes are always separate":
- Column Continuation (§9.2.2) — side-by-side blocks that are one series: same schema, headers repeated, key continuing onward
- Split Tables Sharing a Header (§9.2.9) — fragments that must merge: one header, printed once
The discriminator is own title / own schema. If each box declares what it is and how its columns are named, it stands alone.
a two-sided balance sheet in one frame
Assets down the left, liabilities and equity down the middle, an income statement on the right, all inside one ruled box under two title bands. These are different schemas, not consecutive ranges of a repeated schema. Repeated-schema continuations follow Column Continuation (§9.2.2) even inside one enclosing frame. Row n on the left has nothing to do with row n in the middle, and yet this is one table, row n across all blocks — the frame is one grid and is transcribed as the grid it prints. The side-by-side rule above is for boxes with their own frames.
Source page
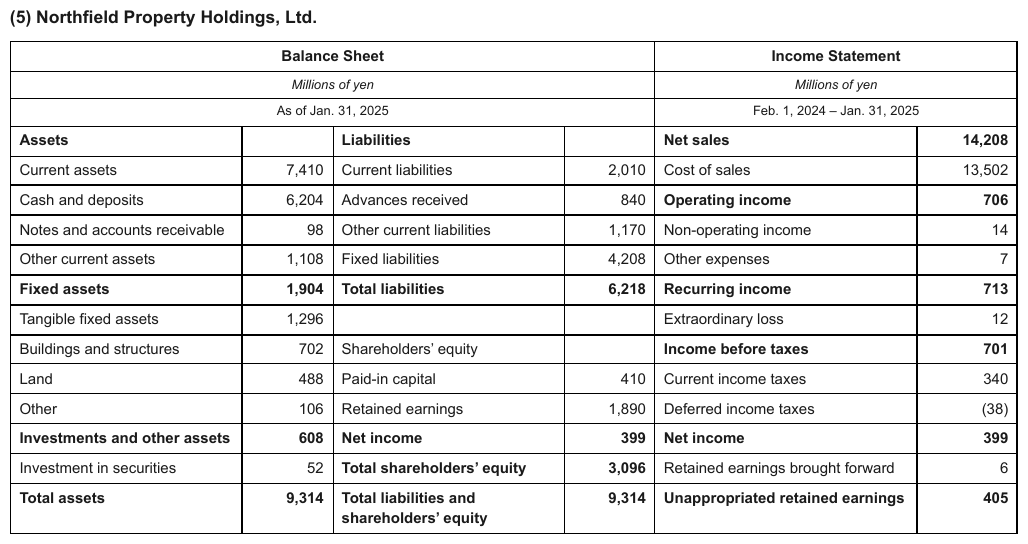
Expected output
| Balance Sheet | Income Statement | ||||
|---|---|---|---|---|---|
| Millions of yen | Millions of yen | ||||
| As of Jan. 31, 2025 | Feb. 1, 2024 – Jan. 31, 2025 | ||||
| Assets | Liabilities | Net sales | 14,208 | ||
| Current assets | 7,410 | Current liabilities | 2,010 | Cost of sales | 13,502 |
| Cash and deposits | 6,204 | Advances received | 840 | Operating income | 706 |
| Notes and accounts receivable | 98 | Other current liabilities | 1,170 | Non-operating income | 14 |
| Other current assets | 1,108 | Fixed liabilities | 4,208 | Other expenses | 7 |
| Fixed assets | 1,904 | Total liabilities | 6,218 | Recurring income | 713 |
| Tangible fixed assets | 1,296 | Extraordinary loss | 12 | ||
| Buildings and structures | 702 | Shareholders’ equity | Income before taxes | 701 | |
| Land | 488 | Paid-in capital | 410 | Current income taxes | 340 |
| Other | 106 | Retained earnings | 1,890 | Deferred income taxes | (38) |
| Investments and other assets | 608 | Net income | 399 | Net income | 399 |
| Investment in securities | 52 | Total shareholders’ equity | 3,096 | Retained earnings brought forward | 6 |
| Total assets | 9,314 | Total liabilities and shareholders’ equity | 9,314 | Unappropriated retained earnings | 405 |
Look-alike
Two similar pages that call for different decisions. Synthetic, for teaching the boundary.
Two blocks, same header, sitting next to each other. One table or two?
Column continuation
| State | Rate |
|---|---|
| AL | 1.10 |
| AK | 1.04 |
| AR | 0.98 |
| State | Rate |
|---|---|
| MT | 0.95 |
| NE | 1.01 |
| NV | 1.12 |
One table per printed block, headers copied.
Independent mini tables
| Period | Mil. |
|---|---|
| 2026Q1 | 3,408 |
| 2025Q4 | 3,377 |
| Period | Mil. |
|---|---|
| 2026Q1 | 412 |
| 2025Q4 | 418 |
Separate tables. Ignore row alignment entirely.
Look at the structure. What evidence changes the answer?
Neighbouring rules, and how they differ
More
Rule id tables-side-by-side-mini-tables · tables boundaries failure-mode