Scatter and Error Bars
A point has two readings—how are x and y recorded?
✅ NormativeSettled. The requirement holds as written.📄 Page ruleCan be applied from the page alone.Read §11.2.8 in the RFC ↗
A named scatter point MUST be rendered as one row holding its x value and its y value. Marker series over categories are ordinary series columns. An error bar's centre is an ordinary value, and its whisker span MUST be given with it: the low and high ends read at the whisker caps. A box plot MUST give its median, first and third quartiles, and its whisker ends when they are drawn. Points with no printed name have nothing to locate them and are not rendered as rows.
Reading the examples. Each one pairs a source page with the output the rule expects. ✅ Sample: the rule applies. ❌ Counter-sample: it looks like it applies and does not, or a rendering got it wrong. A non-conforming output, in red, is shown only for contrast. … marks content left out of an excerpt.
Scatter
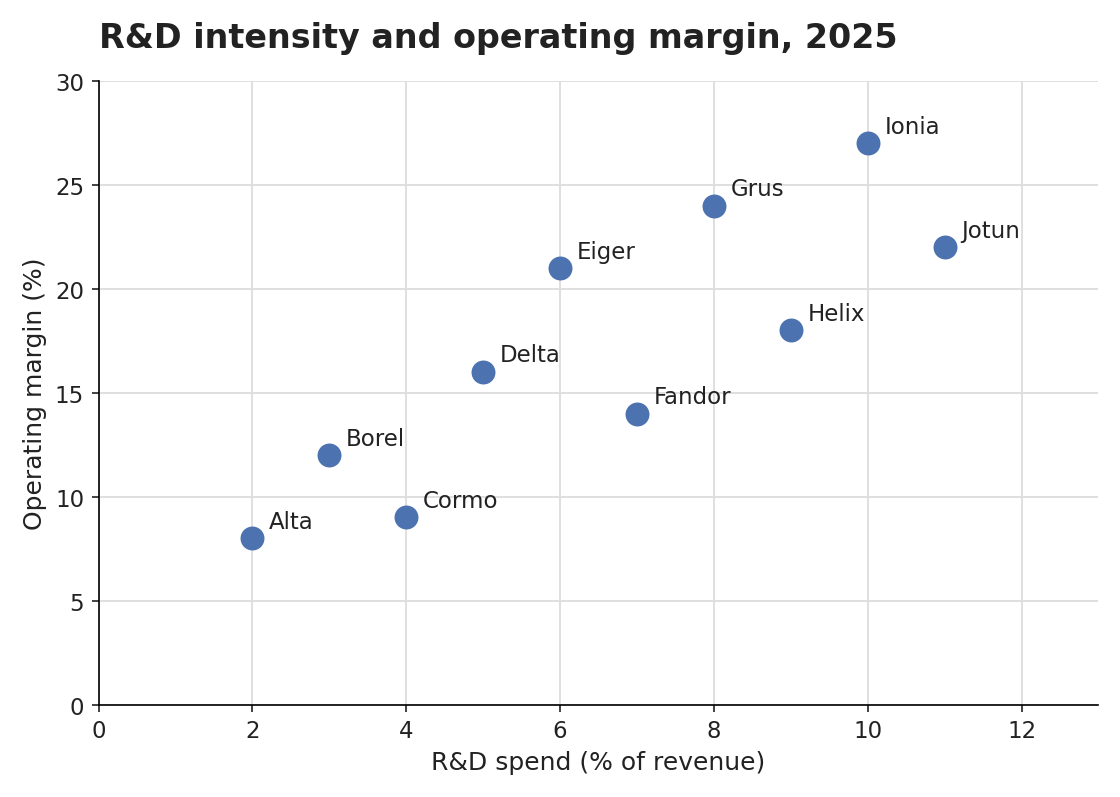
Each named dot contributes its two coordinates, each read against its own axis (see Values and Tolerances (§11.1.4)). A fitted trend line through the cloud is reference ink (see Multiple Charts and Reference Ink (§11.1.3)).
How scatter points, whiskers and boxes appear in the chart table.
- A scatter chart MUST give one row per named point, a column for x and a column for y, each headed by its printed axis title.
- An error bar's interval MUST be written in the centre's cell, after the centre, as
centre (low–high)—3.60 (3.47–3.73). - A box plot MUST give one row per box: its label, then the low whisker end, first quartile, median,
third quartile and high whisker end in axis order, the whisker ends only where drawn, under the
header row
Low|Q1|Median|Q3|High(first cell: the printed label column's title, or empty). These header cells are protocol vocabulary, like the markers[blank]or[logo: …]: the page does not print them, and they are the one deliberate exception to never invent, so that the columns can be read without guessing. They are written exactly as given.
Ten named points, one row each, x and y under the two printed axis titlesmake_scatter
The plotted values are whole numbers by construction; on a printed page they would be estimates, judged with a tolerance.
Source page
Expected output
| R&D spend (% of revenue) | Operating margin (%) | |
|---|---|---|
| Alta | 2 | 8 |
| Borel | 3 | 12 |
| Cormo | 4 | 9 |
| Delta | 5 | 16 |
| Eiger | 6 | 21 |
| Fandor | 7 | 14 |
| Grus | 8 | 24 |
| Helix | 9 | 18 |
| Ionia | 10 | 27 |
| Jotun | 11 | 22 |
Dot and marker series over categories
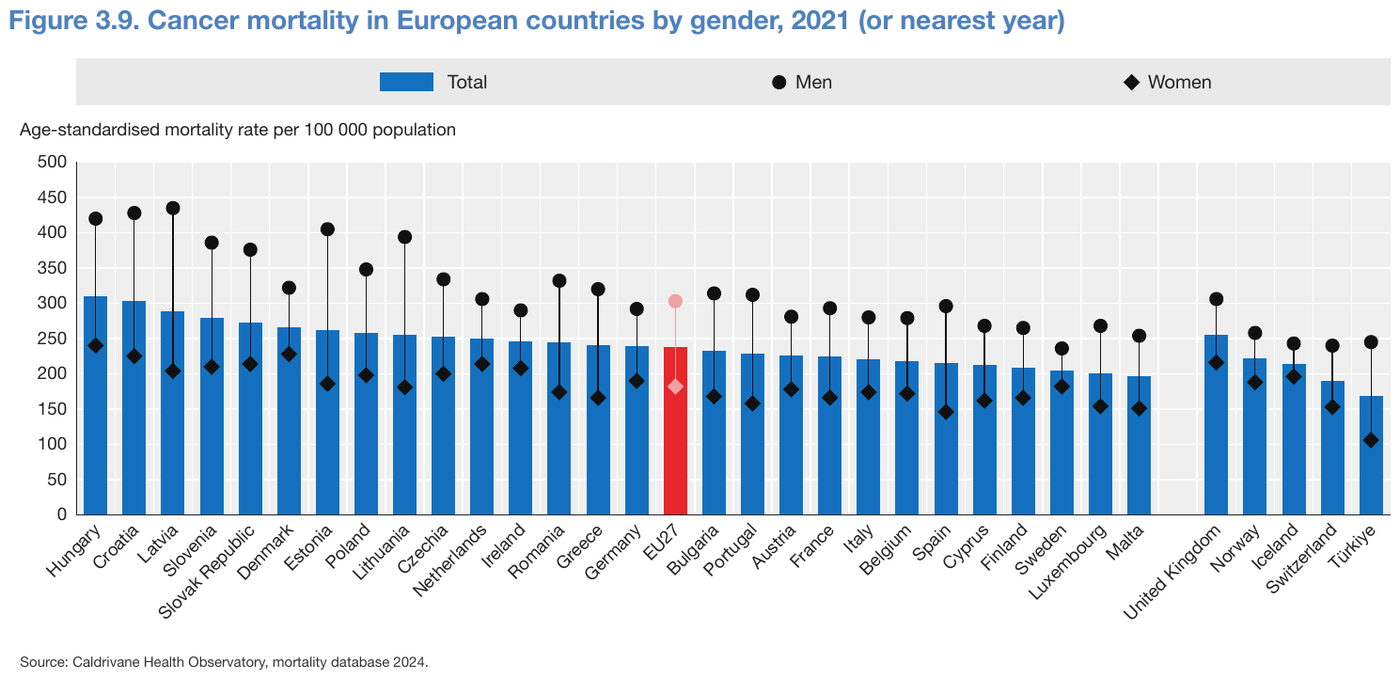
Dots drawn per category — markers above bars, one marker per gender per country — are ordinary series: one column per marker series, one value per mark.
A bar series and two marker series over thirty-three countrieshealth-profile-europe-2024_p105
A bar series and two marker series over thirty-three countries, nothing printed on the marks:
33 × 3 = 99 values, each an estimate on the 50-unit grid (tolerance 0.05 to 0.1 by
readability). The highlighted EU27 bar is an ordinary row. The value-axis title follows the
table.
Source page
Expected output
| Total | Men | Women | |
|---|---|---|---|
| Hungary | 310 | 420 | 240 |
| Croatia | 303 | 428 | 225 |
| Latvia | 288 | 435 | 204 |
| Slovenia | 279 | 386 | 210 |
| Slovak Republic | 272 | 376 | 214 |
| Denmark | 266 | 322 | 228 |
| Estonia | 262 | 405 | 186 |
| Poland | 258 | 348 | 198 |
| Lithuania | 255 | 394 | 181 |
| Czechia | 252 | 334 | 200 |
| Netherlands | 250 | 306 | 214 |
| Ireland | 246 | 290 | 208 |
| Romania | 244 | 332 | 174 |
| Greece | 241 | 320 | 166 |
| Germany | 239 | 292 | 190 |
| EU27 | 238 | 303 | 182 |
| Bulgaria | 233 | 314 | 168 |
| Portugal | 229 | 312 | 158 |
| Austria | 226 | 281 | 178 |
| France | 224 | 293 | 166 |
| Italy | 221 | 280 | 174 |
| Belgium | 218 | 279 | 172 |
| Spain | 215 | 296 | 146 |
| Cyprus | 212 | 268 | 162 |
| Finland | 208 | 265 | 166 |
| Sweden | 205 | 236 | 182 |
| Luxembourg | 201 | 268 | 154 |
| Malta | 197 | 254 | 151 |
| United Kingdom | 255 | 306 | 216 |
| Norway | 222 | 258 | 188 |
| Iceland | 214 | 243 | 196 |
| Switzerland | 190 | 240 | 153 |
| Türkiye | 168 | 245 | 106 |
Age-standardised mortality rate per 100 000 population
Source: Caldrivane Health Observatory, mortality database 2024.
Error bars
The centre is copied when printed and estimated otherwise. The whisker ends are read at the caps against the axis, like any estimate. A whisker whose ends cannot be read honestly is not given an interval.
A checker judges the interval on meaning: it accepts any output that conveys it —
3.60 ± 0.13, 3.60 (3.47–3.73), separate low and high columns, prose — within the tolerance of
an ordinary estimate, and fails a centre given with no interval.
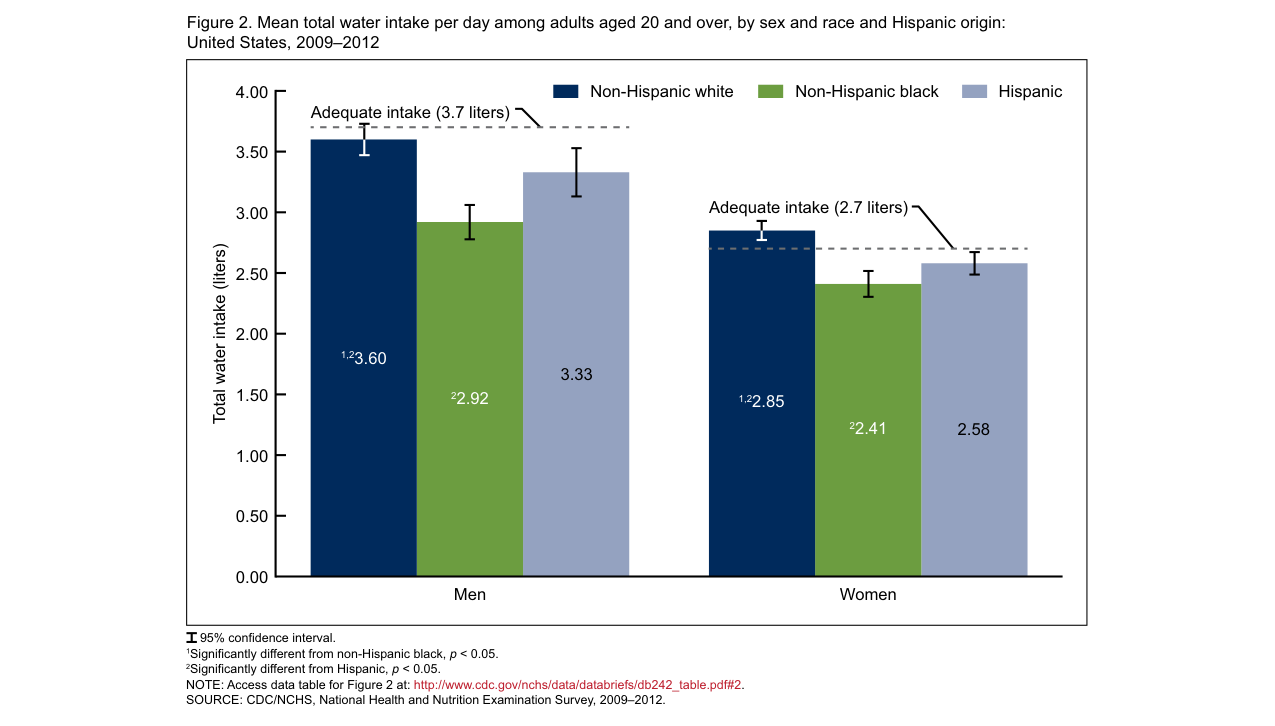
Six bars printing their meansdb242_p2
Six bars printing their means, with footnote markers, and 95% confidence whiskers drawn but not
printed. Each cell holds the printed centre, markers included, followed by the whisker ends read
against the 0.50 grid. The dashed Adequate intake lines are reference ink: their labels follow
the table as text. The whisker symbol before 95% confidence interval. is not text.
Source page
Source: CDC/NCHS, National Health and Nutrition Examination Survey, 2009–2012 — Figure 2 (public domain)
Expected output
| Non-Hispanic white | Non-Hispanic black | Hispanic | |
|---|---|---|---|
| Men | 1,23.60 (3.47–3.73) | 22.92 (2.78–3.06) | 3.33 (3.13–3.53) |
| Women | 1,22.85 (2.76–2.94) | 22.41 (2.29–2.54) | 2.58 (2.49–2.67) |
Total water intake (liters)
Adequate intake (3.7 liters)
Adequate intake (2.7 liters)
95% confidence interval. 1Significantly different from non-Hispanic black, p < 0.05. 2Significantly different from Hispanic, p < 0.05. NOTE: Access data table for Figure 2 at: http://www.cdc.gov/nchs/data/databriefs/db242_table.pdf#2. SOURCE: CDC/NCHS, National Health and Nutrition Examination Survey, 2009–2012.
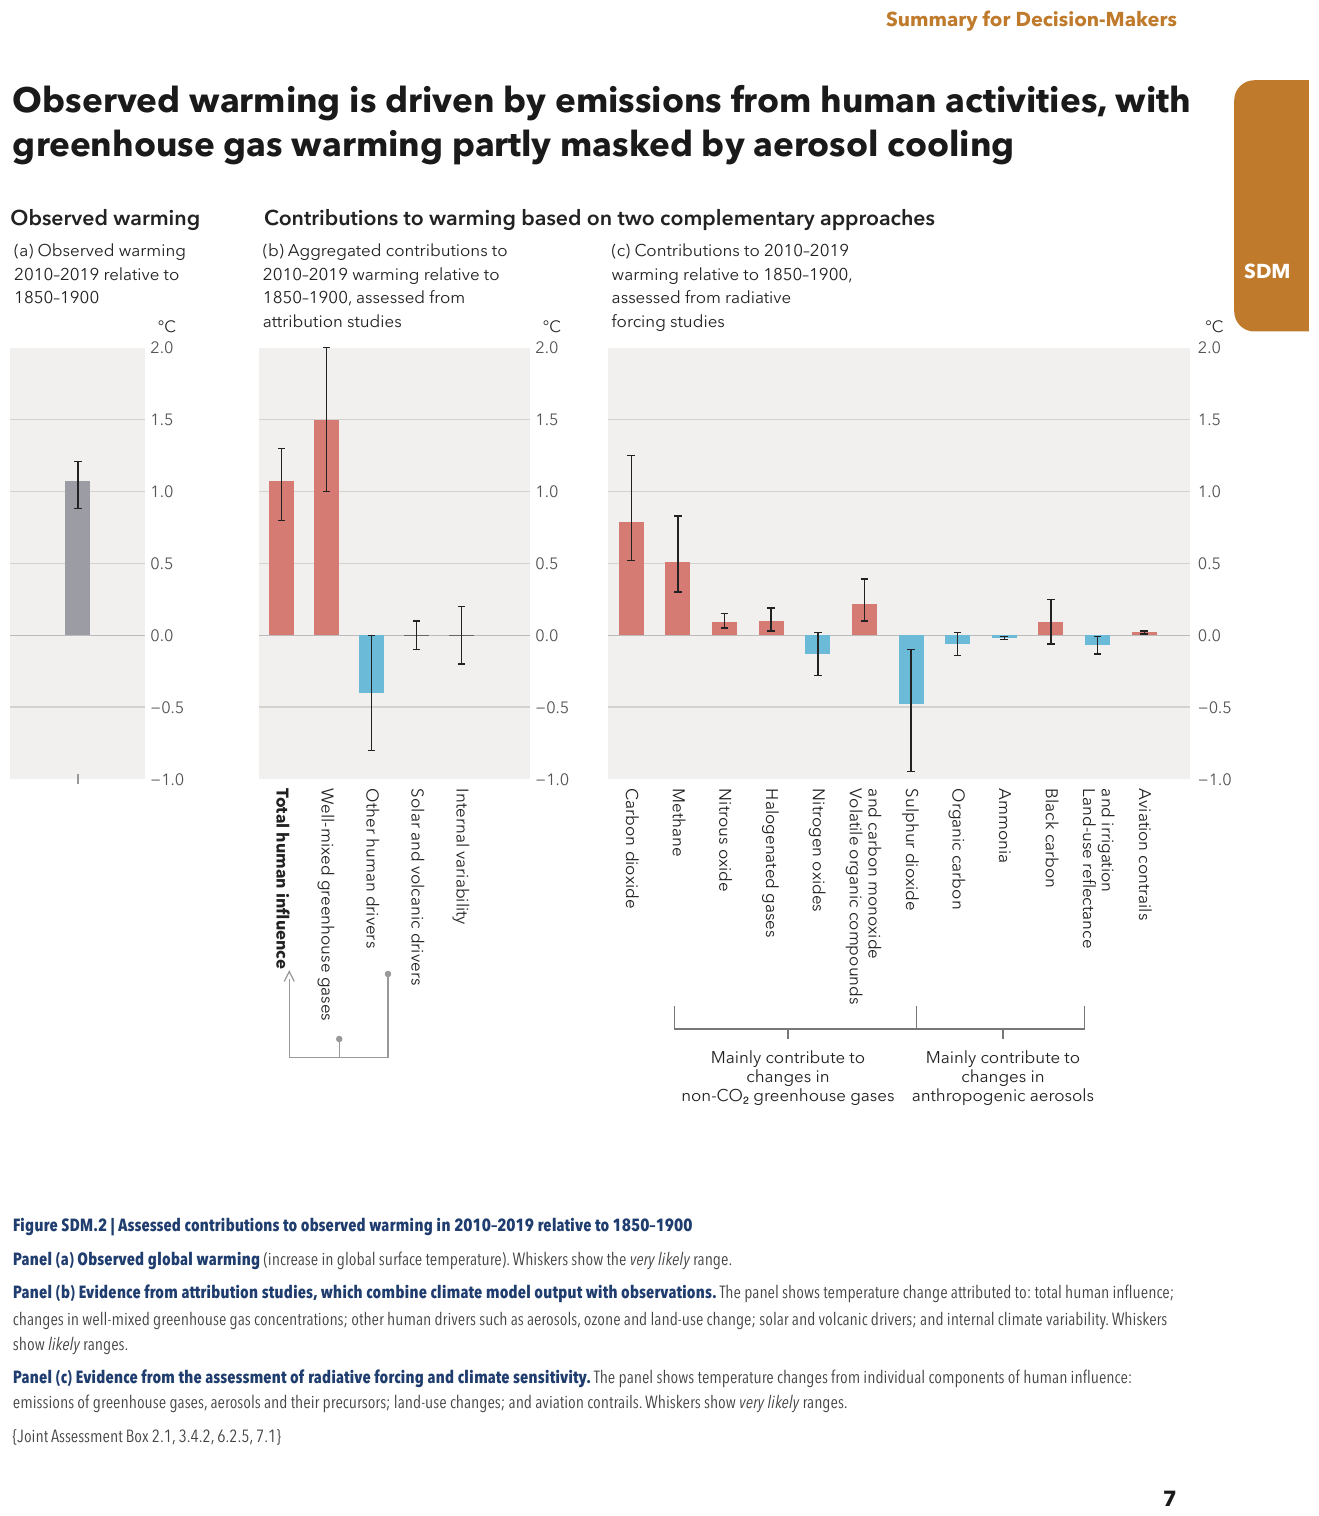
Nothing is printed on any markclimate-assessment-sdm_p7
centres and whisker ends are all estimates on the 0.5 grid. A
three-panel figure, each panel its own table headed by its axis unit (°C): panel (a) has a single
bar with no category label; in panel (b), Solar and volcanic drivers and Internal variability
are drawn on the zero line, so their centre is 0, with whiskers either side. Panel (c) shows its
first three bars, then the rest; its two bracket captions follow its table as text. The page
heading and the figure caption below the panels are elided.
Source page
Expected output · excerpt
…
| °C | |
|---|---|
| 1.07 (0.88–1.21) |
| °C | |
|---|---|
| Total human influence | 1.07 (0.80–1.30) |
| Well-mixed greenhouse gases | 1.50 (1.00–2.00) |
| Other human drivers | -0.40 (-0.80–0.00) |
| Solar and volcanic drivers | 0 (-0.10–0.10) |
| Internal variability | 0 (-0.20–0.20) |
| °C | ||||||||||||||||||||||||||||||||||||||||||||||||||||||||||||||||||||||||||||||||||||||||||||||||||
|---|---|---|---|---|---|---|---|---|---|---|---|---|---|---|---|---|---|---|---|---|---|---|---|---|---|---|---|---|---|---|---|---|---|---|---|---|---|---|---|---|---|---|---|---|---|---|---|---|---|---|---|---|---|---|---|---|---|---|---|---|---|---|---|---|---|---|---|---|---|---|---|---|---|---|---|---|---|---|---|---|---|---|---|---|---|---|---|---|---|---|---|---|---|---|---|---|---|---|
| Carbon dioxide | 0.79 (0.52–1.25) | |||||||||||||||||||||||||||||||||||||||||||||||||||||||||||||||||||||||||||||||||||||||||||||||||
| Methane | 0.51 (0.30–0.83) | |||||||||||||||||||||||||||||||||||||||||||||||||||||||||||||||||||||||||||||||||||||||||||||||||
| Nitrous oxide | 0.09 (0.05–0.15) | |||||||||||||||||||||||||||||||||||||||||||||||||||||||||||||||||||||||||||||||||||||||||||||||||
| … | ||||||||||||||||||||||||||||||||||||||||||||||||||||||||||||||||||||||||||||||||||||||||||||||||||
Mainly contribute to changes in non-CO2 greenhouse gases
Mainly contribute to changes in anthropogenic aerosols
…
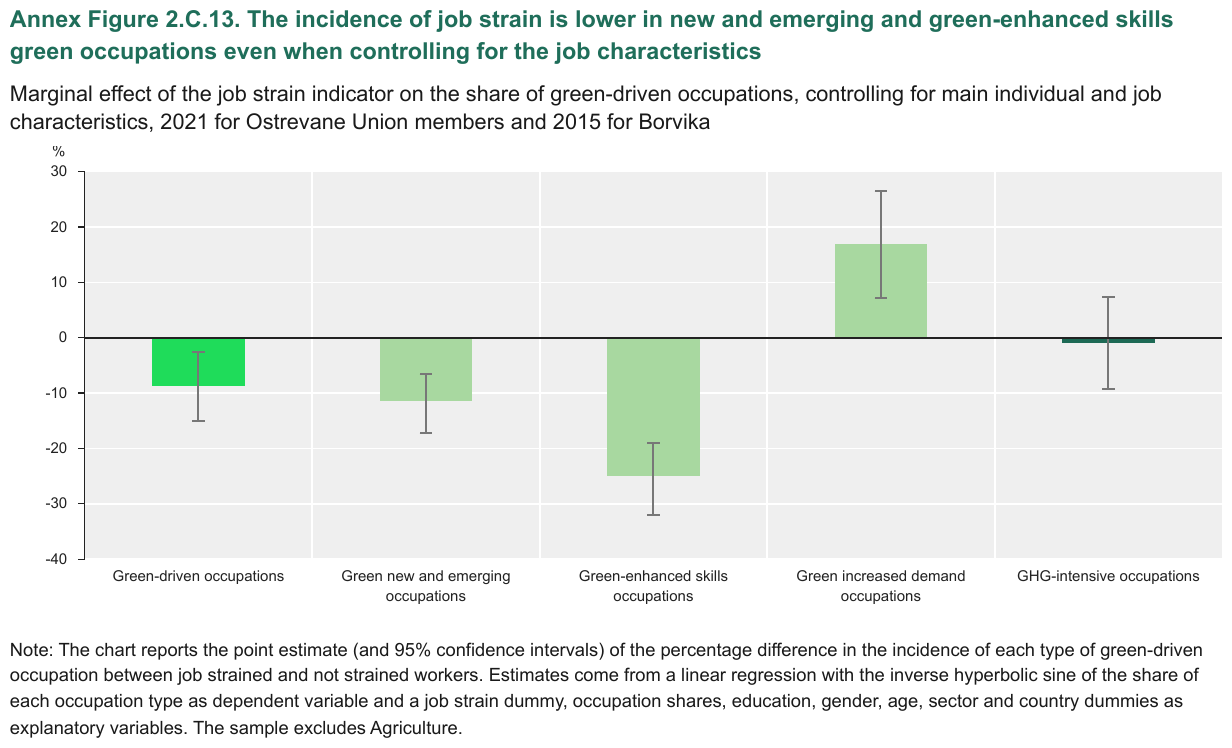
Five bars with confidence whiskers, nothing printedac8b3538-en_p131
five rows, negatives included, each with its
interval. The whisker ends are read at the drawn caps against the printed axis. The
GHG-intensive occupations bar sits almost on zero: a relative tolerance means little there, so a
checker widens it (0.3) rather than tightening the reading.
Source page
Expected output
| % | |
|---|---|
| Green-driven occupations | -8.7 (-15–-2.6) |
| Green new and emerging occupations | -11.5 (-17.2–-6.6) |
| Green-enhanced skills occupations | -25 (-32.1–-19) |
| Green increased demand occupations | 17 (7.2–26.6) |
| GHG-intensive occupations | -1 (-9.3–7.3) |
Note: The chart reports the point estimate (and 95% confidence intervals) of the percentage difference in the incidence of each type of green-driven occupation between job strained and not strained workers. Estimates come from a linear regression with the inverse hyperbolic sine of the share of each occupation type as dependent variable and a job strain dummy, occupation shares, education, gender, age, sector and country dummies as explanatory variables. The sample excludes Agriculture.
Box plots
A box's median, quartiles and drawn whisker ends are read from the geometry. Statistics printed beside the plot are text on the page and are copied as printed.
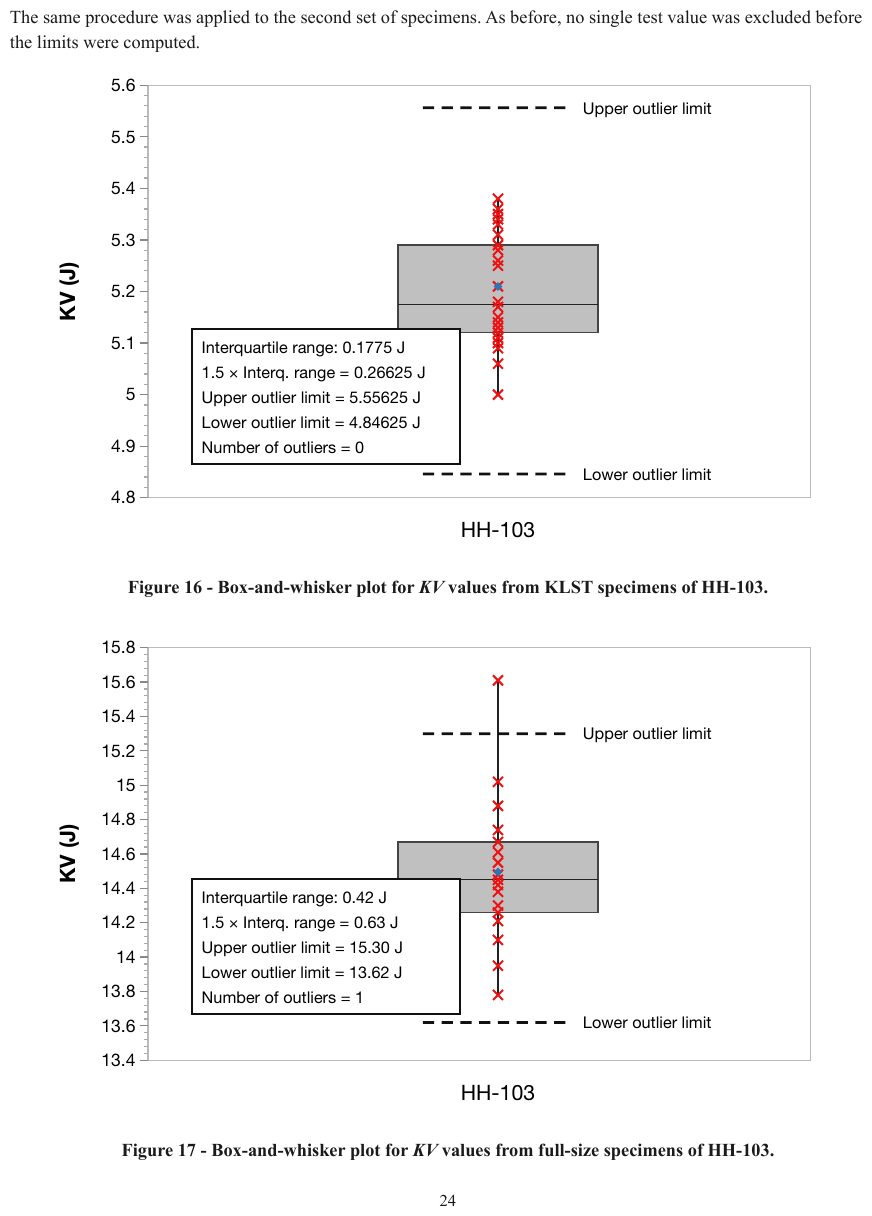
Two box plotscharpy_verification_p24
Two box plots, both over the category HH-103, each its own table under its own figure caption,
which tells them apart. Each box gives five readings against its axis; the printed annotation box
and the labels of the dashed outlier-limit lines follow the table as text. The individual test
values (crosses) and the mean marker carry no name and are not rows.
Source page
Expected output
The same procedure was applied to the second set of specimens. As before, no single test value was excluded before the limits were computed.
| Low | Q1 | Median | Q3 | High | |
|---|---|---|---|---|---|
| HH-103 | 5.00 | 5.12 | 5.18 | 5.29 | 5.38 |
KV (J)
Upper outlier limit
Interquartile range: 0.1775 J 1.5 × Interq. range = 0.26625 J Upper outlier limit = 5.55625 J Lower outlier limit = 4.84625 J Number of outliers = 0
Lower outlier limit
| Low | Q1 | Median | Q3 | High | |
|---|---|---|---|---|---|
| HH-103 | 13.78 | 14.26 | 14.45 | 14.67 | 15.61 |
KV (J)
Upper outlier limit
Interquartile range: 0.42 J 1.5 × Interq. range = 0.63 J Upper outlier limit = 15.30 J Lower outlier limit = 13.62 J Number of outliers = 1
Lower outlier limit
Neighbouring rules, and how they differ
More
Sample sources1 +
Public-domain U.S. federal government source material.
- CDC/NCHS, National Health and Nutrition Examination Survey, 2009–2012 — Figure 2
Rule id charts-scatter-and-error-bars · charts types