Header Wrap vs Real Tier
One wrapped label, or two levels of headers?
✅ NormativeSettled. The requirement holds as written.📄 Page ruleCan be applied from the page alone.Read §9.3.2 in the RFC ↗
A header line with a rule beneath it, standing over two or more self-standing leaf labels, is a real tier and MUST be rendered as its own header row. Fragments that simply stack with no border and read as one phrase are a wrapped label and MUST be joined with a space into a single header cell.
When it applies
As printed:

As parsed — the failure:

Only "Common Stock" is a real tier here: it has a rule beneath it and spans two self-standing leaves, Shares and Amount. The other three are single wrapped labels — "Capital in Excess of Par Value" is one column heading broken across two lines to fit. Treating all four the same way splits every wrapped label into a phantom two-row tier, which is the error this rule prevents (never invent).
Wrapped header text looks exactly like a two-row tier, so the test is run deliberately rather than by eye.
Wrap (one header, join with a space):     Real tier (parent phrase over leaves):
| Published    |                          | (Paid as of 12-31-2020) |
| Availability |                          |   2018    |    2019     |
  ↑ fragments concatenate, no border        ↑ spans two sub-columns
Reading the examples. Each one pairs a source page with the output the rule expects. ✅ Sample: the rule applies. ❌ Counter-sample: it looks like it applies and does not, or a rendering got it wrong. A non-conforming output, in red, is shown only for contrast. … marks content left out of an excerpt.
The test
- A rule beneath the upper line. A printed border under a label, with columns continuing below it, points to a tier.
- The lower labels on their own. If each stands as a complete column heading — Shares, Amount, 2018, 2019 — the line above is a tier over them. If the lines only make sense concatenated, they are one wrapped label.
- The span. A tier covers two or more leaf columns. A label that sits over exactly one column is a wrap, whatever its line count.
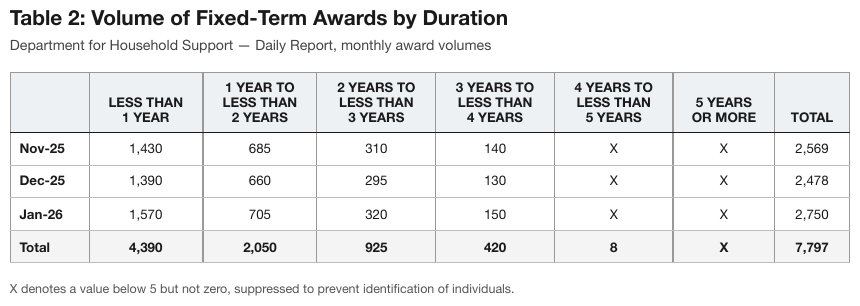
1 YEAR TO / LESS THAN / 2 YEARS wraps across three printed lines and is one header labelwqa
The
month labels and the Total row are bold.
Source page
Expected output
| LESS THAN 1 YEAR | 1 YEAR TO LESS THAN 2 YEARS | 2 YEARS TO LESS THAN 3 YEARS | 3 YEARS TO LESS THAN 4 YEARS | 4 YEARS TO LESS THAN 5 YEARS | 5 YEARS OR MORE | TOTAL | |
|---|---|---|---|---|---|---|---|
| Nov-25 | 1,430 | 685 | 310 | 140 | X | X | 2,569 |
| Dec-25 | 1,390 | 660 | 295 | 130 | X | X | 2,478 |
| Jan-26 | 1,570 | 705 | 320 | 150 | X | X | 2,750 |
| Total | 4,390 | 2,050 | 925 | 420 | 8 | X | 7,797 |
Committee Membership Until 2025 Meetinged
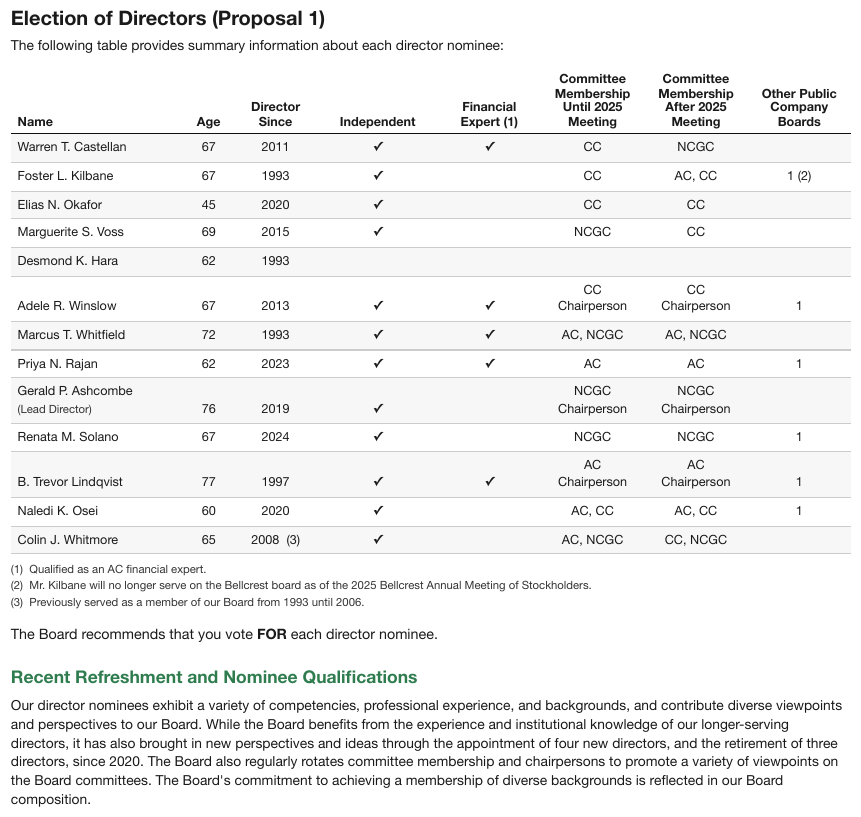
Committee Membership Until 2025 Meeting — one label wrapped over four lines, not a colspan tier.
The checkmarks are rendered as [yes] (see Marks and Symbols in Cells (§9.6.6)).
Source page
Expected output
| Name | Age | Director Since | Independent | Financial Expert (1) | Committee Membership Until 2025 Meeting | Committee Membership After 2025 Meeting | Other Public Company Boards |
|---|---|---|---|---|---|---|---|
| Warren T. Castellan | 67 | 2011 | [yes] | [yes] | CC | NCGC | |
| Foster L. Kilbane | 67 | 1993 | [yes] | CC | AC, CC | 1 (2) | |
| Elias N. Okafor | 45 | 2020 | [yes] | CC | CC | ||
| Marguerite S. Voss | 69 | 2015 | [yes] | NCGC | CC | ||
| Desmond K. Hara | 62 | 1993 | |||||
| Adele R. Winslow | 67 | 2013 | [yes] | [yes] | CC Chairperson | CC Chairperson | 1 |
| Marcus T. Whitfield | 72 | 1993 | [yes] | [yes] | AC, NCGC | AC, NCGC | |
| Priya N. Rajan | 62 | 2023 | [yes] | [yes] | AC | AC | 1 |
| Gerald P. Ashcombe (Lead Director) | 76 | 2019 | [yes] | NCGC Chairperson | NCGC Chairperson | ||
| Renata M. Solano | 67 | 2024 | [yes] | NCGC | NCGC | 1 | |
| B. Trevor Lindqvist | 77 | 1997 | [yes] | [yes] | AC Chairperson | AC Chairperson | 1 |
| Naledi K. Osei | 60 | 2020 | [yes] | AC, CC | AC, CC | 1 | |
| Colin J. Whitmore | 65 | 2008 (3) | [yes] | AC, NCGC | CC, NCGC |
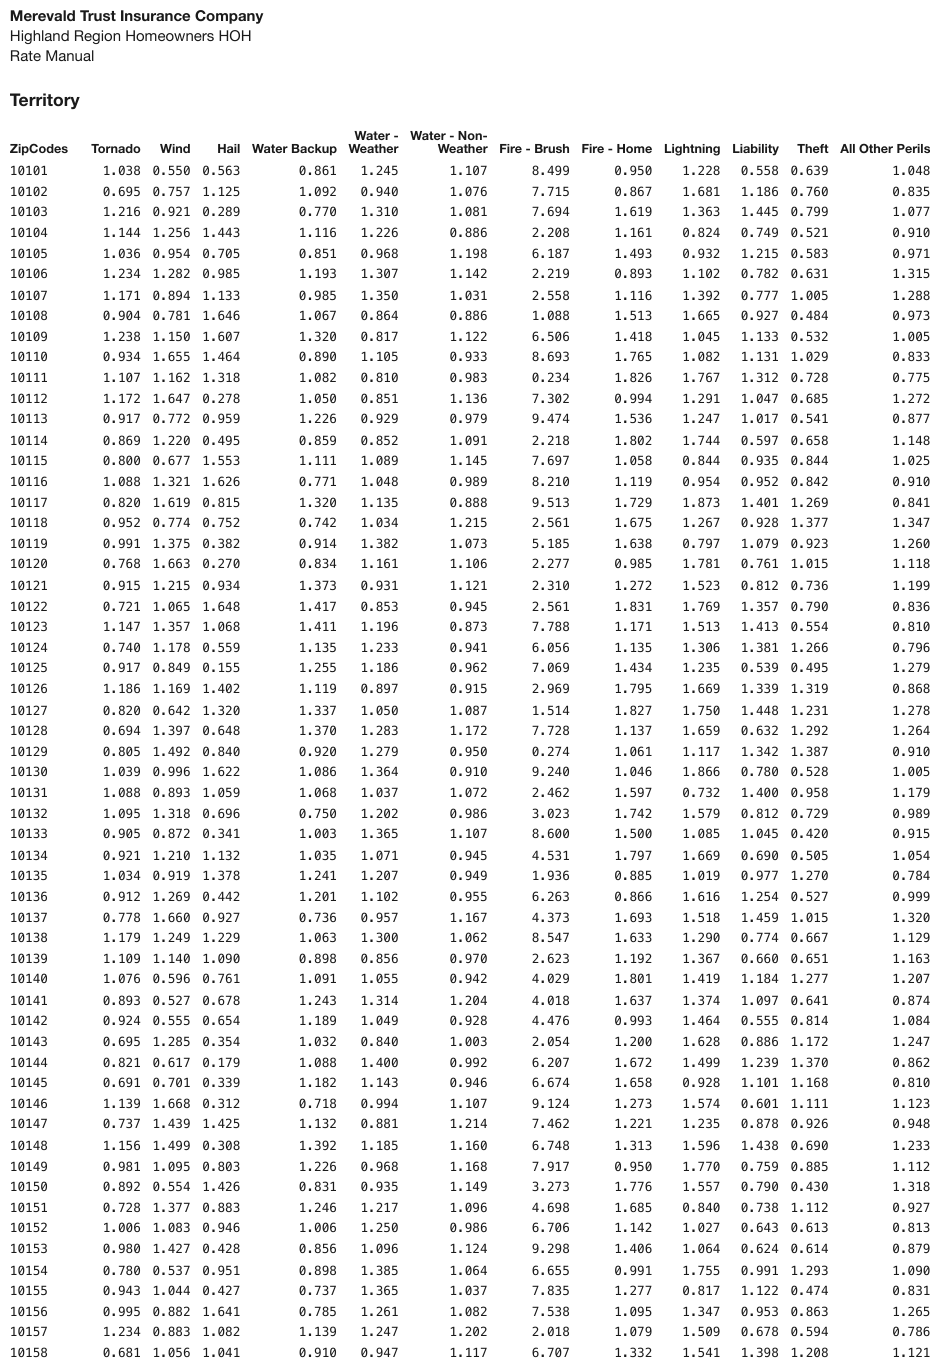
Water - Weather and Water - Non-Weather each wrap two lineswat
both are single labels.
Source page
Expected output · excerpt
| ZipCodes | Tornado | Wind | Hail | Water Backup | Water - Weather | Water - Non-Weather | Fire - Brush | Fire - Home | Lightning | Liability | Theft | All Other Perils | ||||||||||||||||||||||||||||||||||||||||||||||||||||||||||||||||||||||||||||||||||||||
|---|---|---|---|---|---|---|---|---|---|---|---|---|---|---|---|---|---|---|---|---|---|---|---|---|---|---|---|---|---|---|---|---|---|---|---|---|---|---|---|---|---|---|---|---|---|---|---|---|---|---|---|---|---|---|---|---|---|---|---|---|---|---|---|---|---|---|---|---|---|---|---|---|---|---|---|---|---|---|---|---|---|---|---|---|---|---|---|---|---|---|---|---|---|---|---|---|---|---|
| 10101 | 1.038 | 0.550 | 0.563 | 0.861 | 1.245 | 1.107 | 8.499 | 0.950 | 1.228 | 0.558 | 0.639 | 1.048 | ||||||||||||||||||||||||||||||||||||||||||||||||||||||||||||||||||||||||||||||||||||||
| 10102 | 0.695 | 0.757 | 1.125 | 1.092 | 0.940 | 1.076 | 7.715 | 0.867 | 1.681 | 1.186 | 0.760 | 0.835 | ||||||||||||||||||||||||||||||||||||||||||||||||||||||||||||||||||||||||||||||||||||||
| 10103 | 1.216 | 0.921 | 0.289 | 0.770 | 1.310 | 1.081 | 7.694 | 1.619 | 1.363 | 1.445 | 0.799 | 1.077 | ||||||||||||||||||||||||||||||||||||||||||||||||||||||||||||||||||||||||||||||||||||||
| 10104 | 1.144 | 1.256 | 1.443 | 1.116 | 1.226 | 0.886 | 2.208 | 1.161 | 0.824 | 0.749 | 0.521 | 0.910 | ||||||||||||||||||||||||||||||||||||||||||||||||||||||||||||||||||||||||||||||||||||||
| 10105 | 1.036 | 0.954 | 0.705 | 0.851 | 0.968 | 1.198 | 6.187 | 1.493 | 0.932 | 1.215 | 0.583 | 0.971 | ||||||||||||||||||||||||||||||||||||||||||||||||||||||||||||||||||||||||||||||||||||||
| 10106 | 1.234 | 1.282 | 0.985 | 1.193 | 1.307 | 1.142 | 2.219 | 0.893 | 1.102 | 0.782 | 0.631 | 1.315 | ||||||||||||||||||||||||||||||||||||||||||||||||||||||||||||||||||||||||||||||||||||||
| … | ||||||||||||||||||||||||||||||||||||||||||||||||||||||||||||||||||||||||||||||||||||||||||||||||||
5line heaer
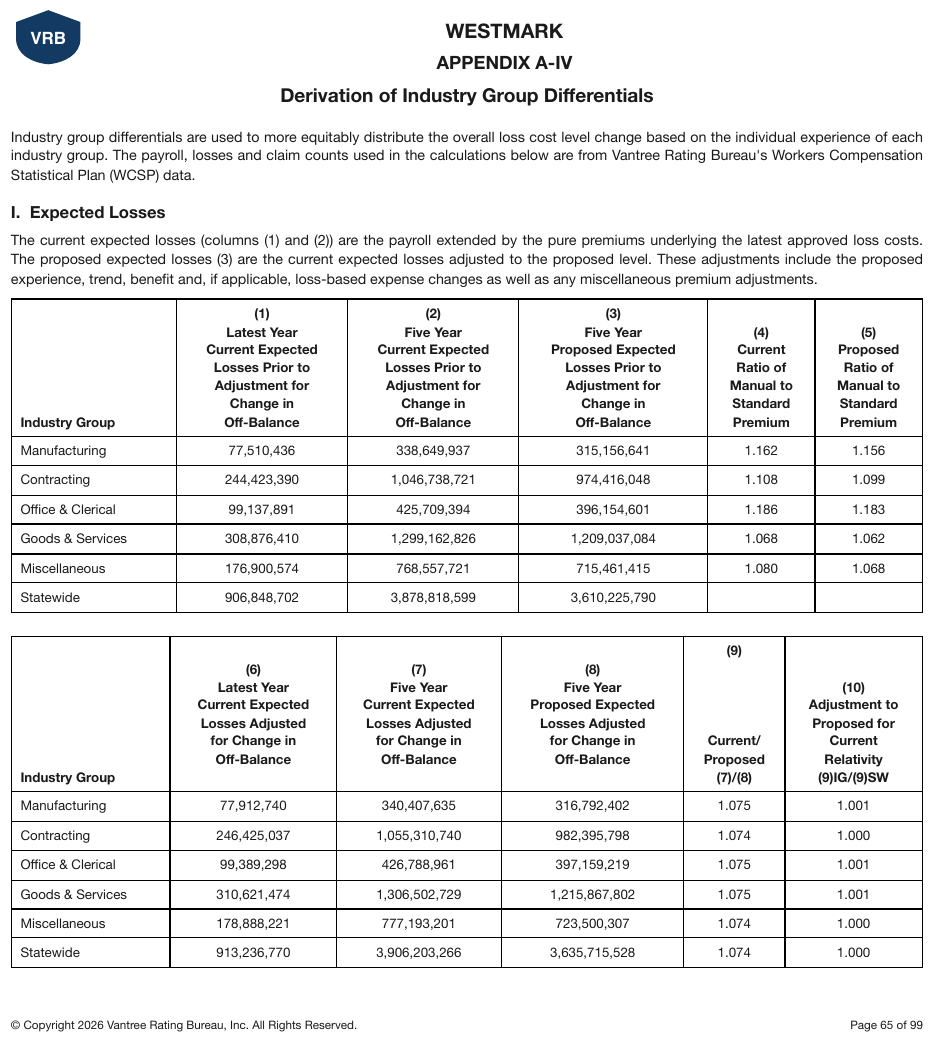
Every header is one label wrapped over many lines, e.g. (1) Latest Year Current Expected Losses…; each is joined with spaces into one cell.
Source page
Expected output · table 1 of 2
| Industry Group | (1) Latest Year Current Expected Losses Prior to Adjustment for Change in Off-Balance | (2) Five Year Current Expected Losses Prior to Adjustment for Change in Off-Balance | (3) Five Year Proposed Expected Losses Prior to Adjustment for Change in Off-Balance | (4) Current Ratio of Manual to Standard Premium | (5) Proposed Ratio of Manual to Standard Premium |
|---|---|---|---|---|---|
| Manufacturing | 77,510,436 | 338,649,937 | 315,156,641 | 1.162 | 1.156 |
| Contracting | 244,423,390 | 1,046,738,721 | 974,416,048 | 1.108 | 1.099 |
| Office & Clerical | 99,137,891 | 425,709,394 | 396,154,601 | 1.186 | 1.183 |
| Goods & Services | 308,876,410 | 1,299,162,826 | 1,209,037,084 | 1.068 | 1.062 |
| Miscellaneous | 176,900,574 | 768,557,721 | 715,461,415 | 1.080 | 1.068 |
| Statewide | 906,848,702 | 3,878,818,599 | 3,610,225,790 |
Non-conforming output
What the rule rules out.
| Industry Group | (1) Latest Year Current Expected Losses Prior to Adjustment for Change in Off-Balance | (2) Five Year Current Expected Losses Prior to Adjustment for Change in Off-Balance | (3) Five Year Proposed Expected Losses Prior to Adjustment for Change in Off-Balance | (4) Current Ratio of Manual to Standard Premium | (5) Proposed Ratio of Manual to Standard Premium | |||||||||||||||||||||||||||||||||||||||||||||||||||||||||||||||||||||||||||||||||||||||||||||
|---|---|---|---|---|---|---|---|---|---|---|---|---|---|---|---|---|---|---|---|---|---|---|---|---|---|---|---|---|---|---|---|---|---|---|---|---|---|---|---|---|---|---|---|---|---|---|---|---|---|---|---|---|---|---|---|---|---|---|---|---|---|---|---|---|---|---|---|---|---|---|---|---|---|---|---|---|---|---|---|---|---|---|---|---|---|---|---|---|---|---|---|---|---|---|---|---|---|---|
| … | ||||||||||||||||||||||||||||||||||||||||||||||||||||||||||||||||||||||||||||||||||||||||||||||||||
MAINTAIN CURRENT COVERAGE2linebug
No Action Required wrapped across five lines in one cell. The bracketed field numbers are printed text, the empty boxes are unchecked checkboxes, and the header rows are padded where the payment column has no header. The call-out box covers the first two columns of its row.
Source page
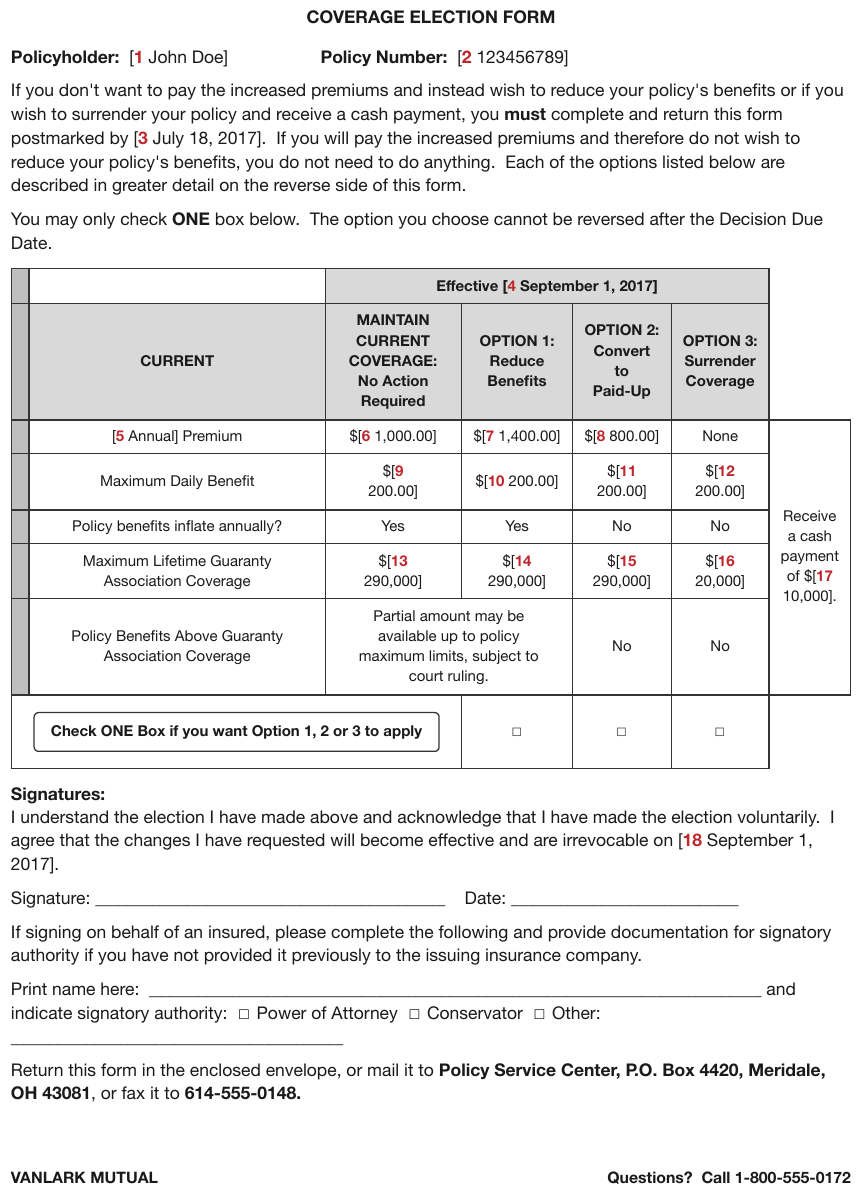
Expected output
| Effective \[4 September 1, 2017\] | |||||
|---|---|---|---|---|---|
| CURRENT | MAINTAIN CURRENT COVERAGE: No Action Required | OPTION 1: Reduce Benefits | OPTION 2: Convert to Paid-Up | OPTION 3: Surrender Coverage | |
| \[5 Annual\] Premium | $\[6 1,000.00\] | $\[7 1,400.00\] | $\[8 800.00\] | None | Receive a cash payment of $\[17 10,000\]. |
| Maximum Daily Benefit | $\[9 200.00\] | $\[10 200.00\] | $\[11 200.00\] | $\[12 200.00\] | |
| Policy benefits inflate annually? | Yes | Yes | No | No | |
| Maximum Lifetime Guaranty Association Coverage | $\[13 290,000\] | $\[14 290,000\] | $\[15 290,000\] | $\[16 20,000\] | |
| Policy Benefits Above Guaranty Association Coverage | Partial amount may be available up to policy maximum limits, subject to court ruling. | No | No | ||
| Check ONE Box if you want Option 1, 2 or 3 to apply | [ ] | [ ] | [ ] | ||
The case that catches people out
A parent phrase can be wrapped and be a tier. "(Paid as of 12-31-2020)" is broken across lines and spans its sub-columns — so "it wrapped" never settles the question on its own. The span does: a phrase that covers more than one leaf column MUST be kept as a tier with its exact colspan, however many lines it takes. A phrase that covers one column is joined into that column's label.
POOLED RETURN (%) wraps across stacked lines in a narrow column and is one header3t
POOLED RETURN (%) wraps across stacked lines in a narrow column and is one header — the contrast
against a real tier. The coloured title band spans the whole block, and the bold 1997-2017 row
closes it.
Source page
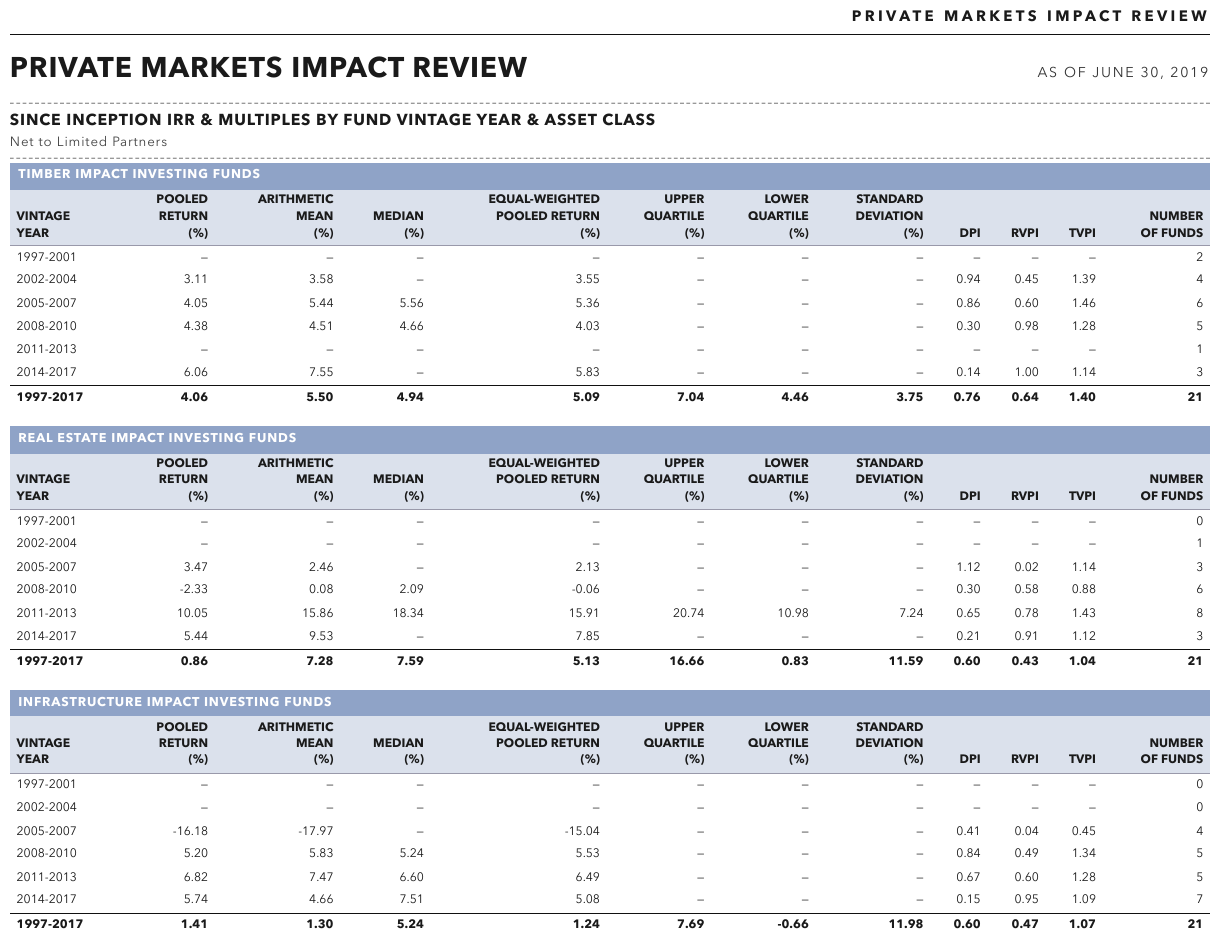
Expected output · table 1 of 3
| TIMBER IMPACT INVESTING FUNDS | |||||||||||
|---|---|---|---|---|---|---|---|---|---|---|---|
| VINTAGE YEAR | POOLED RETURN (%) | ARITHMETIC MEAN (%) | MEDIAN (%) | EQUAL-WEIGHTED POOLED RETURN (%) | UPPER QUARTILE (%) | LOWER QUARTILE (%) | STANDARD DEVIATION (%) | DPI | RVPI | TVPI | NUMBER OF FUNDS |
| 1997-2001 | — | — | — | — | — | — | — | — | — | — | 2 |
| 2002-2004 | 3.11 | 3.58 | — | 3.55 | — | — | — | 0.94 | 0.45 | 1.39 | 4 |
| 2005-2007 | 4.05 | 5.44 | 5.56 | 5.36 | — | — | — | 0.86 | 0.60 | 1.46 | 6 |
| 2008-2010 | 4.38 | 4.51 | 4.66 | 4.03 | — | — | — | 0.30 | 0.98 | 1.28 | 5 |
| 2011-2013 | — | — | — | — | — | — | — | — | — | — | 1 |
| 2014-2017 | 6.06 | 7.55 | — | 5.83 | — | — | — | 0.14 | 1.00 | 1.14 | 3 |
| 1997-2017 | 4.06 | 5.50 | 4.94 | 5.09 | 7.04 | 4.46 | 3.75 | 0.76 | 0.64 | 1.40 | 21 |
A label broken inside a word
A space join assumes the break falls between words. When a narrow column breaks inside a word
— Distributio / n, Appointe / d — the fragments MUST be joined with nothing:
Distribution, Appointed. A wrap with a printed hyphen inside a word (per- / form- / ance)
is joined the same way, dropping the hyphens. A hyphen that belongs to the word, as in a compound,
stays — see Line-End Hyphenation (§7.2.7). Only a break between words gets a space.
a header wrapped mid-word
Under each scenario the first sub-column is headed Distributio over n; the tier above it
(Liquidation - Low, Liquidation - High, Recovery Per Plan) has a rule beneath and spans the
sub-columns, so the tier test still holds. The $ printed in its own track joins its value.
Source page
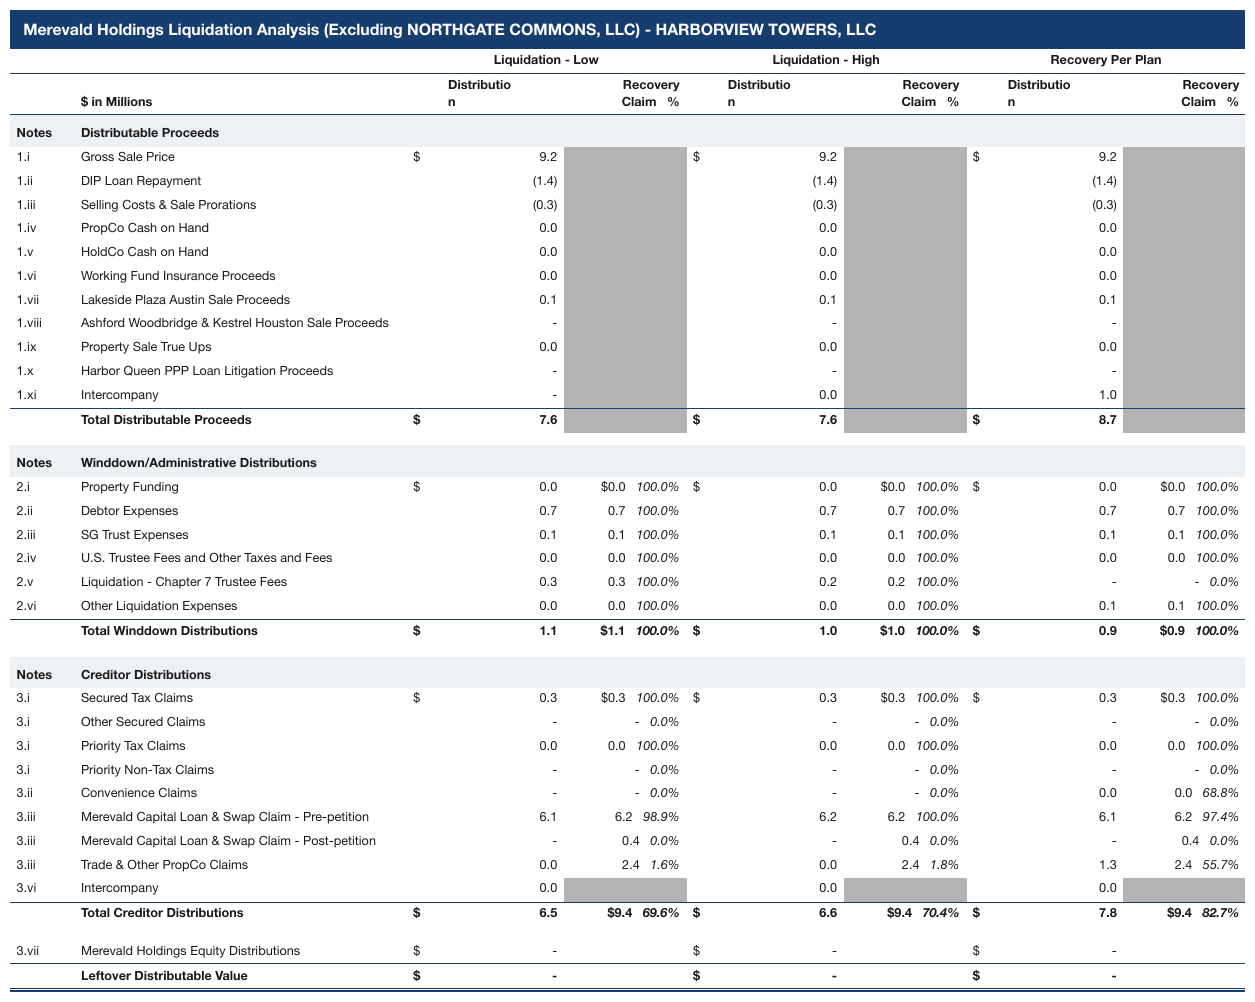
Expected output · excerpt
| Liquidation - Low | Liquidation - High | Recovery Per Plan | ||||||||||||||||||||||||||||||||||||||||||||||||||||||||||||||||||||||||||||||||||||||||||||||||
|---|---|---|---|---|---|---|---|---|---|---|---|---|---|---|---|---|---|---|---|---|---|---|---|---|---|---|---|---|---|---|---|---|---|---|---|---|---|---|---|---|---|---|---|---|---|---|---|---|---|---|---|---|---|---|---|---|---|---|---|---|---|---|---|---|---|---|---|---|---|---|---|---|---|---|---|---|---|---|---|---|---|---|---|---|---|---|---|---|---|---|---|---|---|---|---|---|---|---|
| $ in Millions | Distribution | Recovery Claim % | Distribution | Recovery Claim % | Distribution | Recovery Claim % | ||||||||||||||||||||||||||||||||||||||||||||||||||||||||||||||||||||||||||||||||||||||||||||
| Notes | Distributable Proceeds | |||||||||||||||||||||||||||||||||||||||||||||||||||||||||||||||||||||||||||||||||||||||||||||||||
| 1.i | Gross Sale Price | $9.2 | $9.2 | $9.2 | ||||||||||||||||||||||||||||||||||||||||||||||||||||||||||||||||||||||||||||||||||||||||||||||
| 1.ii | DIP Loan Repayment | (1.4) | (1.4) | (1.4) | ||||||||||||||||||||||||||||||||||||||||||||||||||||||||||||||||||||||||||||||||||||||||||||||
| 1.iii | Selling Costs & Sale Prorations | (0.3) | (0.3) | (0.3) | ||||||||||||||||||||||||||||||||||||||||||||||||||||||||||||||||||||||||||||||||||||||||||||||
| … | ||||||||||||||||||||||||||||||||||||||||||||||||||||||||||||||||||||||||||||||||||||||||||||||||||
| Total Distributable Proceeds | $7.6 | $7.6 | $8.7 | |||||||||||||||||||||||||||||||||||||||||||||||||||||||||||||||||||||||||||||||||||||||||||||||
| Notes | Winddown/Administrative Distributions | |||||||||||||||||||||||||||||||||||||||||||||||||||||||||||||||||||||||||||||||||||||||||||||||||
| 2.i | Property Funding | $0.0 | $0.0 100.0% | $0.0 | $0.0 100.0% | $0.0 | $0.0 100.0% | |||||||||||||||||||||||||||||||||||||||||||||||||||||||||||||||||||||||||||||||||||||||||||
| … | ||||||||||||||||||||||||||||||||||||||||||||||||||||||||||||||||||||||||||||||||||||||||||||||||||
a wrap with printed hyphens
Trading / per- / form- / ance wraps over four lines with the hyphens printed. Joining with a
space would give per- form- ance; the page means performance. See Line-End Hyphenation (§7.2.7).
Source page
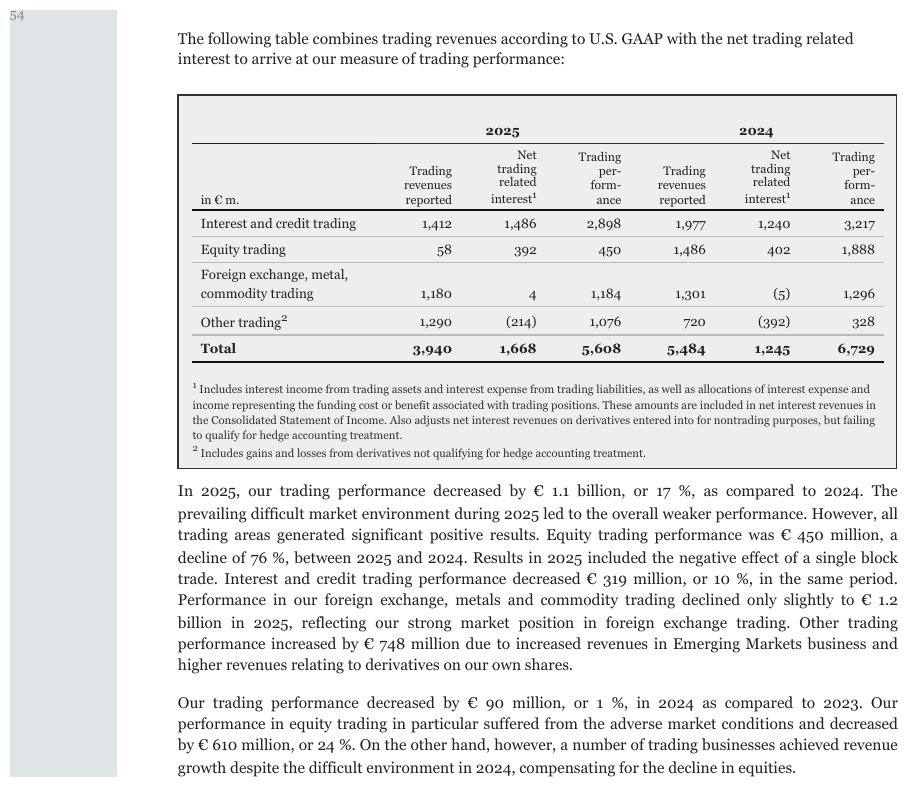
Expected output · the table
| 2025 | 2024 | |||||
|---|---|---|---|---|---|---|
| in € m. | Trading revenues reported | Net trading related interest1 | Trading performance | Trading revenues reported | Net trading related interest1 | Trading performance |
| Interest and credit trading | 1,412 | 1,486 | 2,898 | 1,977 | 1,240 | 3,217 |
| Equity trading | 58 | 392 | 450 | 1,486 | 402 | 1,888 |
| Foreign exchange, metal, commodity trading | 1,180 | 4 | 1,184 | 1,301 | (5) | 1,296 |
| Other trading2 | 1,290 | (214) | 1,076 | 720 | (392) | 328 |
| Total | 3,940 | 1,668 | 5,608 | 5,484 | 1,245 | 6,729 |
a wrap that breaks inside a word, twice
Appointe / d / business over the first column of each year group, and Non- /
appointed / business beside it. One wrap breaks a word with no hyphen and joins to Appointed;
the other breaks at the hyphen of the compound Non-appointed, which is kept. The £'m line is a
units row, and the empty gutter between the year groups is not a column.
Source page
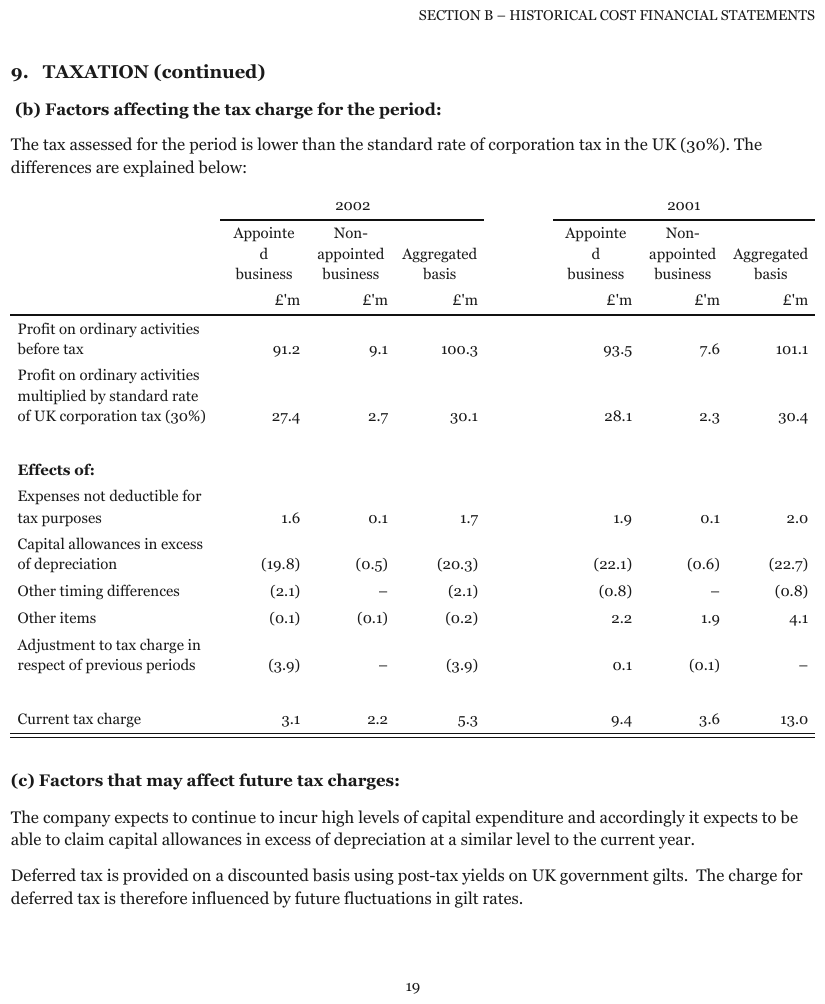
Expected output · excerpt
| 2002 | 2001 | |||||||||||||||||||||||||||||||||||||||||||||||||||||||||||||||||||||||||||||||||||||||||||||||||
|---|---|---|---|---|---|---|---|---|---|---|---|---|---|---|---|---|---|---|---|---|---|---|---|---|---|---|---|---|---|---|---|---|---|---|---|---|---|---|---|---|---|---|---|---|---|---|---|---|---|---|---|---|---|---|---|---|---|---|---|---|---|---|---|---|---|---|---|---|---|---|---|---|---|---|---|---|---|---|---|---|---|---|---|---|---|---|---|---|---|---|---|---|---|---|---|---|---|---|
| Appointed business | Non-appointed business | Aggregated basis | Appointed business | Non-appointed business | Aggregated basis | |||||||||||||||||||||||||||||||||||||||||||||||||||||||||||||||||||||||||||||||||||||||||||||
| £'m | £'m | £'m | £'m | £'m | £'m | |||||||||||||||||||||||||||||||||||||||||||||||||||||||||||||||||||||||||||||||||||||||||||||
| Profit on ordinary activities before tax | 91.2 | 9.1 | 100.3 | 93.5 | 7.6 | 101.1 | ||||||||||||||||||||||||||||||||||||||||||||||||||||||||||||||||||||||||||||||||||||||||||||
| Profit on ordinary activities multiplied by standard rate of UK corporation tax (30%) | 27.4 | 2.7 | 30.1 | 28.1 | 2.3 | 30.4 | ||||||||||||||||||||||||||||||||||||||||||||||||||||||||||||||||||||||||||||||||||||||||||||
| Effects of: | ||||||||||||||||||||||||||||||||||||||||||||||||||||||||||||||||||||||||||||||||||||||||||||||||||
| Expenses not deductible for tax purposes | 1.6 | 0.1 | 1.7 | 1.9 | 0.1 | 2.0 | ||||||||||||||||||||||||||||||||||||||||||||||||||||||||||||||||||||||||||||||||||||||||||||
| … | ||||||||||||||||||||||||||||||||||||||||||||||||||||||||||||||||||||||||||||||||||||||||||||||||||
| Current tax charge | 3.1 | 2.2 | 5.3 | 9.4 | 3.6 | 13.0 | ||||||||||||||||||||||||||||||||||||||||||||||||||||||||||||||||||||||||||||||||||||||||||||
Look-alike
Two similar pages that call for different decisions. Synthetic, for teaching the boundary.
A header label on two lines. One wrapped label, or a parent tier over leaves?
Wrapped label
| Capital in Excess of Par Value | Retained Earnings |
|---|---|
| 12,404 | 98,112 |
| 12,001 | 91,730 |
Join with a space into one header cell.
Real tier
| Common Stock | |
|---|---|
| Shares | Amount |
| 15,943 | $16 |
| 15,908 | $16 |
Keep the tier with its exact colspan.
Look at the structure. What evidence changes the answer?
Neighbouring rules, and how they differ
More
Rule id tables-header-wrap-vs-real-tier · tables headers heuristic