Slide Diagrams
A labelled concept diagram—what survives when there is no settled encoding?
✅ NormativeSettled. The requirement holds as written.📄 Page ruleCan be applied from the page alone.Read §12.2.5 in the RFC ↗
A labelled figure MUST use a suitable diagram/<language> encoding when one can preserve its
content faithfully, following the language priorities in Diagrams and Flowcharts (§12.2.2). A labelled figure that no suitable diagram language can faithfully express MUST
be rendered as a fenced description block in the fixed shape: one line saying what the figure is,
then one bullet per printed label, verbatim, followed only by what is visibly drawn there, then
printed values and notes. The block MUST NOT explain what a label means.
When it applies
A slide diagram or scientific figure is a picture whose meaning lives in its labels: names of parts, signal names, arrows showing direction. The labels are content and MUST NOT be lost. A plain prose description SHOULD be used only when the figure carries no labels at all.
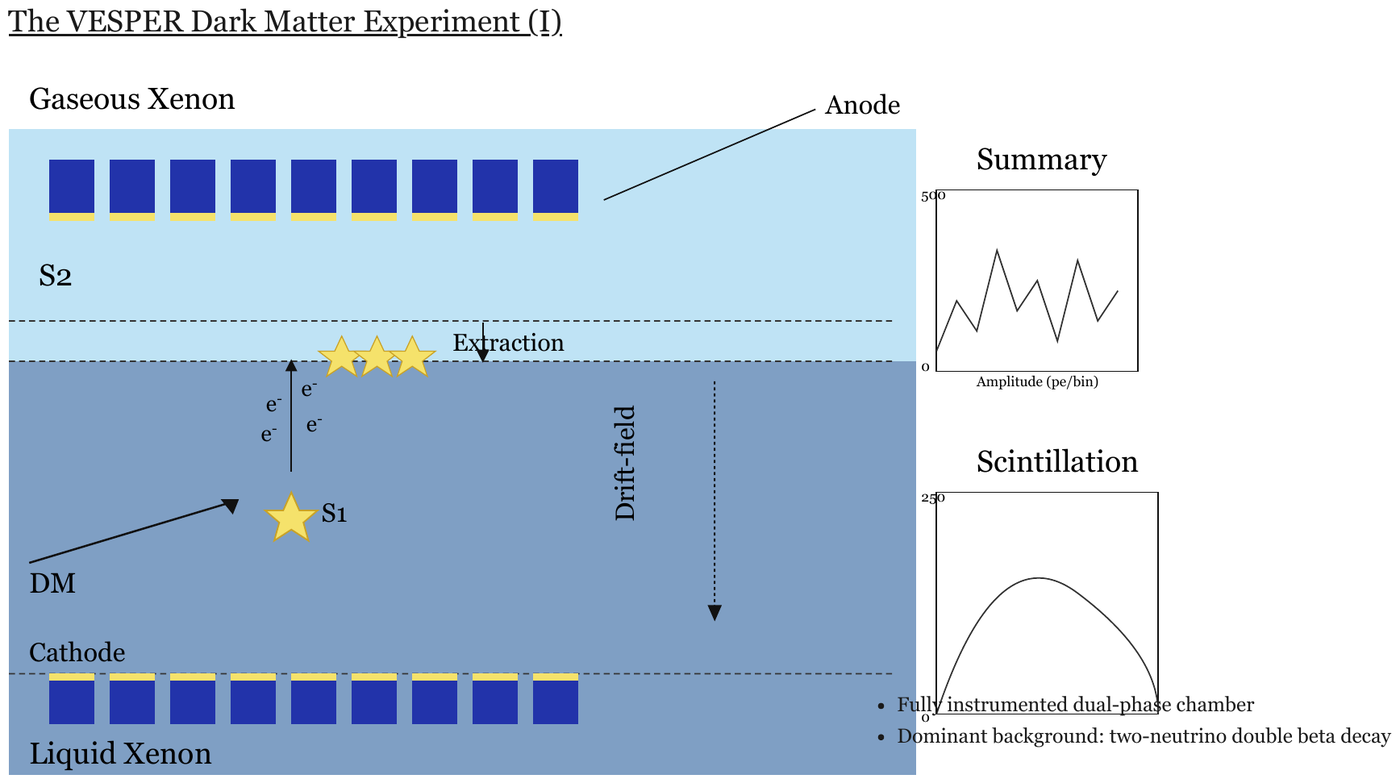
A slide: its title, a detector cross-section with labels, two small charts (Summary,
Scintillation) and two bullets. The cross-section is transcribed by the description block below;
the title, charts and bullets are separate elements.
Reading the examples. Each one pairs a source page with the output the rule expects. ✅ Sample: the rule applies. ❌ Counter-sample: it looks like it applies and does not, or a rendering got it wrong. A non-conforming output, in red, is shown only for contrast. … marks content left out of an excerpt.
Choose a language that fits the figure
Where the figure's content is labelled parts joined by drawn lines or arrows, it is a graph, and
Mermaid, PlantUML or another suitable language can carry it: preserve each labelled part, drawn connector, direction and meaningful position.
Where no suitable language preserves the content of a cross-section, apparatus or anatomy drawing,
use the description fallback block.
The description block
The block is a fenced code block tagged description, in the same fixed shape used for every described
figure (see Blueprints (§12.2.1) and Electrical Schematics (§12.2.3)):
- The figure's printed title as a
##heading, if it prints one; then one line saying what the figure is, in plain visual terms. - One bullet per printed label, in reading order, the label in bold and verbatim, followed only by what is visibly drawn at it — "arrow pointing down", "row of squares at the top". A label printed several times is listed once with its count.
- Printed values, scales and notes, verbatim.
What a label means — "secondary scintillation signal produced in the gaseous phase" — is domain knowledge, not printed, and MUST NOT appear (never invent). Text around the figure — a slide title, bullets, small charts beside the drawing — is rendered as its own elements outside the block; a chart becomes a chart table.
```description
Cross-section of a two-layer detector.
- **Gaseous Xenon**: upper layer
- **Anode**: line to the row of squares at the top
- **S2**: in the upper layer
- **Extraction**: arrow pointing down at the boundary between the layers
- **e<sup>-</sup>** (four times): beside an arrow pointing up
- **Drift-field**: dotted arrow pointing down
- **S1**: beside a star
- **DM**: arrow pointing to the star
- **Cathode**: row of squares at the bottom
- **Liquid Xenon**: lower layer
```
Superscripts and subscripts inside the block stay inline as <sup> / <sub>, the same as anywhere
else — see Superscript and Subscript (§7.2.11). Equations inside the block stay in $$ … $$ — see
Inline Equations (§7.2.6).
Why the fenced block
The fence gives the region a boundary, so a chunker keeps the diagram's labels together rather than scattering them into surrounding prose — and a consumer that does not want diagrams can strip the block wholesale.
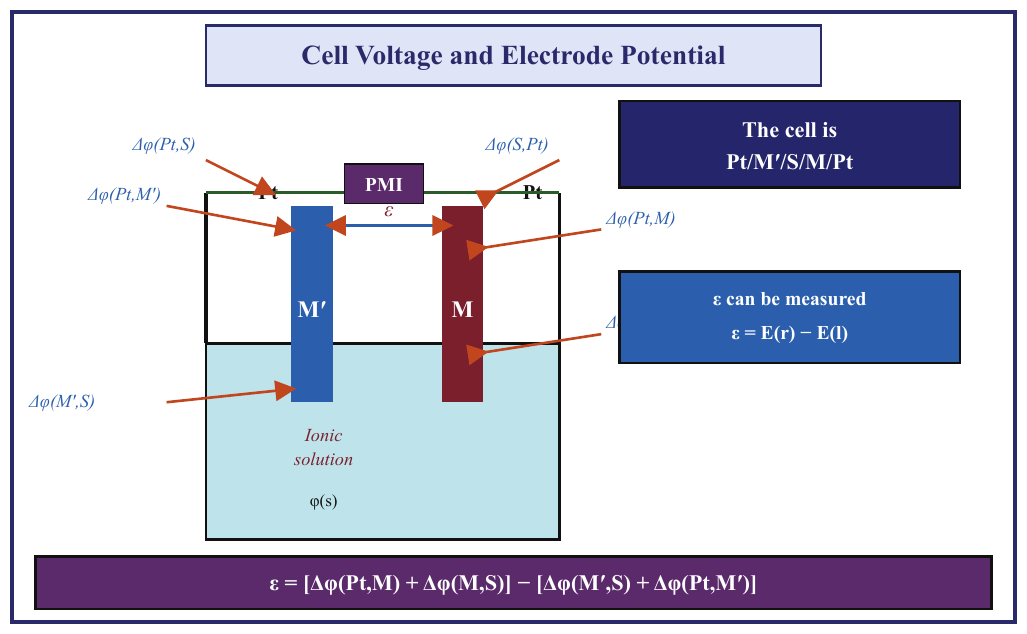
an electrochemical cell with an equation in it
Two electrodes in a solution, Δφ(…) labels with arrows, boxed text (The cell is Pt/M′/S/M/Pt, ε can be measured) and a full equation along the bottom edge. Every string
belongs to the figure. Six arrows point at the electrodes, but only five Δφ(…) labels are
legible: the sixth, at the right, is hidden behind the ε can be measured box, and only its
leading Δ shows — so only the Δ is transcribed. Expected boxes: the whole framed figure as one
Picture box.
Source page
Expected output
## Cell Voltage and Electrode Potential
The diagram shows an electrochemical cell: electrodes M′ and M stand in a vessel whose lower part holds an ionic solution, a wire joins their tops through a PMI box, and six arrows point at the electrodes and contacts.
- **Pt**: contact on the wire at the top of each electrode, left and right.
- **PMI**: box on the wire between the two electrodes.
- **ε**: double-headed arrow between the two electrodes, below the PMI.
- **M′**: left electrode.
- **M**: right electrode.
- **Ionic solution**: the liquid in the lower part of the vessel.
- **φ(s)**: printed in the solution.
- **Δφ(Pt,S)**: arrow to the left Pt contact.
- **Δφ(S,Pt)**: arrow to the right Pt contact.
- **Δφ(Pt,M′)**: arrow to the top of electrode M′.
- **Δφ(M′,S)**: arrow to electrode M′ in the solution.
- **Δφ(Pt,M)**: arrow to the top of electrode M.
- **Δ**: arrow to electrode M at the solution surface; the rest of the label is hidden behind the "ε can be measured" box.
- **The cell is Pt/M′/S/M/Pt**: boxed statement, top right.
- **ε can be measured**: boxed statement, right, followed by $$\varepsilon = E(r) - E(l)$$
- Equation along the bottom edge: $$\varepsilon = [\Delta\varphi(Pt,M) + \Delta\varphi(M,S)] - [\Delta\varphi(M',S) + \Delta\varphi(Pt,M')]$$
Neighbouring rules, and how they differ
More
Rule id diagrams-slide-diagrams · images diagrams