Units Row
Units below the labels—a header or a data row?
⚖️ Equivalent formsTwo renderings conform. A document uses one of them throughout.📄 Page ruleCan be applied from the page alone.Read §9.3.5 in the RFC ↗
A units line under the header MAY be rendered as a second header row, or folded into the header label above it ("Premium ($000)"). Both forms conform, and a document MUST use one of them throughout (see Choices Made Once Per Document (§4.2)). A units line MUST NOT become the first body row.
When it applies
| Premium | Losses | Ratio |
| ($000)  | ($000) | (%)   |   ← units line: a header tier, or folded into
| 1,204   | 887    | 73.6  |     the labels as "Premium ($000)"
Reading the examples. Each one pairs a source page with the output the rule expects. ✅ Sample: the rule applies. ❌ Counter-sample: it looks like it applies and does not, or a rendering got it wrong. A non-conforming output, in red, is shown only for contrast. … marks content left out of an excerpt.
Recognising it
A units line sits directly beneath the header, carries no values, and repeats the same kind of
token across the columns — ($000), (%), (millions), (points). Every entry describes how to
read the column below it rather than reporting a measurement.
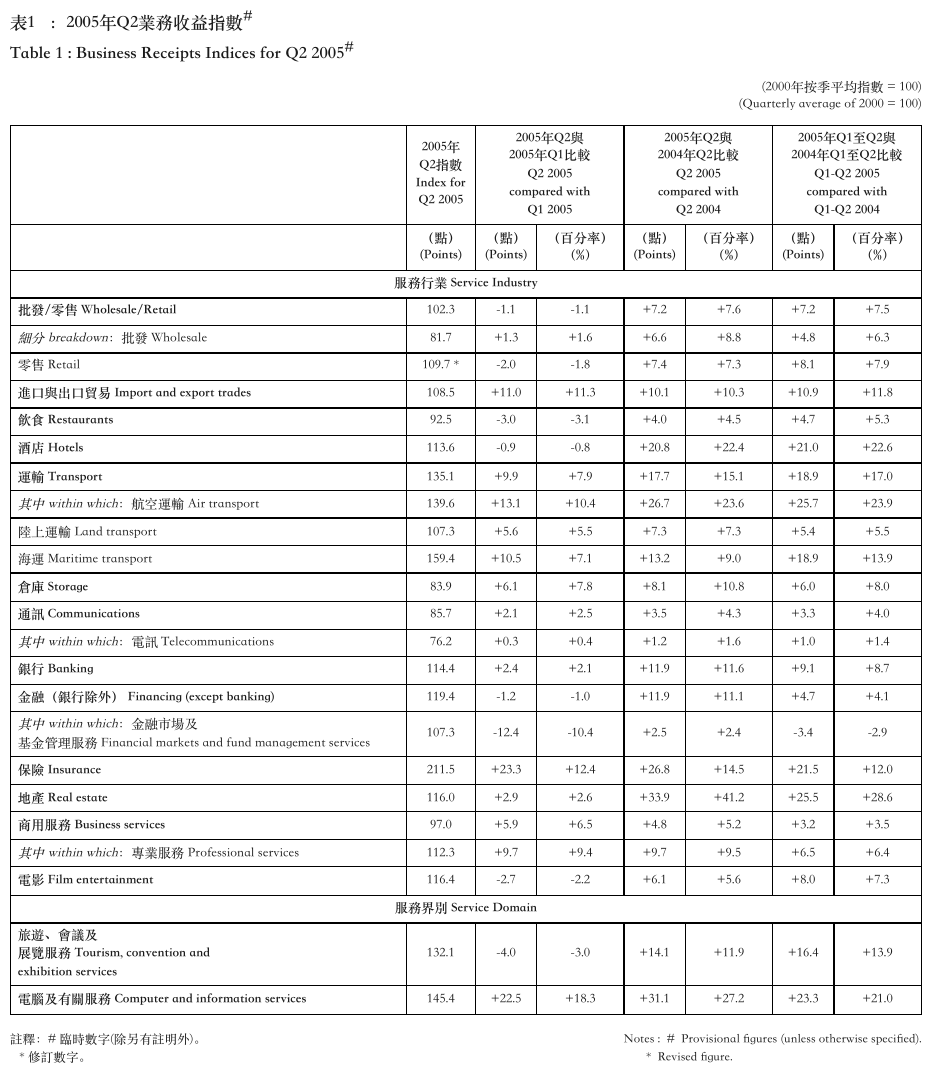
A (點) (Points) / (百分率) (%) row under the main header states units, not dataP200509160137_0137_6519
here it is kept as a second header row.
Source page
Expected output · excerpt
| 2005年Q2指數 Index for Q2 2005 | 2005年Q2與2005年Q1比較 Q2 2005 compared with Q1 2005 | 2005年Q2與2004年Q2比較 Q2 2005 compared with Q2 2004 | 2005年Q1至Q2與2004年Q1至Q2比較 Q1-Q2 2005 compared with Q1-Q2 2004 | |||||||||||||||||||||||||||||||||||||||||||||||||||||||||||||||||||||||||||||||||||||||||||||||
|---|---|---|---|---|---|---|---|---|---|---|---|---|---|---|---|---|---|---|---|---|---|---|---|---|---|---|---|---|---|---|---|---|---|---|---|---|---|---|---|---|---|---|---|---|---|---|---|---|---|---|---|---|---|---|---|---|---|---|---|---|---|---|---|---|---|---|---|---|---|---|---|---|---|---|---|---|---|---|---|---|---|---|---|---|---|---|---|---|---|---|---|---|---|---|---|---|---|---|
| (點) (Points) | (點) (Points) | (百分率) (%) | (點) (Points) | (百分率) (%) | (點) (Points) | (百分率) (%) | ||||||||||||||||||||||||||||||||||||||||||||||||||||||||||||||||||||||||||||||||||||||||||||
| 服務行業 Service Industry | ||||||||||||||||||||||||||||||||||||||||||||||||||||||||||||||||||||||||||||||||||||||||||||||||||
| 批發/零售 Wholesale/Retail | 102.3 | -1.1 | -1.1 | +7.2 | +7.6 | +7.2 | +7.5 | |||||||||||||||||||||||||||||||||||||||||||||||||||||||||||||||||||||||||||||||||||||||||||
| 細分 breakdown:批發 Wholesale | 81.7 | +1.3 | +1.6 | +6.6 | +8.8 | +4.8 | +6.3 | |||||||||||||||||||||||||||||||||||||||||||||||||||||||||||||||||||||||||||||||||||||||||||
| … | ||||||||||||||||||||||||||||||||||||||||||||||||||||||||||||||||||||||||||||||||||||||||||||||||||
The two conforming forms
Second header row. The line is kept as its own header row, aligned to the columns it describes, and the values below stay bare. This is closest to what is printed.
Folded into the label. The unit is appended to the header text — "Premium ($000)". This is the most useful for downstream extraction, because the unit travels with the field. It does edit the header string, which sits awkwardly beside the verbatim posture of Cell Text Fidelity (§9.6.3), so the second header row SHOULD be preferred when a document uses units lines heavily.
The outcome to avoid
A units line MUST NOT be rendered as a body row. It is not merely inelegant: a reader of the first
body row then gets ($000) as a premium value. Where the choice between the two conforming forms
is unclear, the second header row is the default.
a units row in the middle of the body
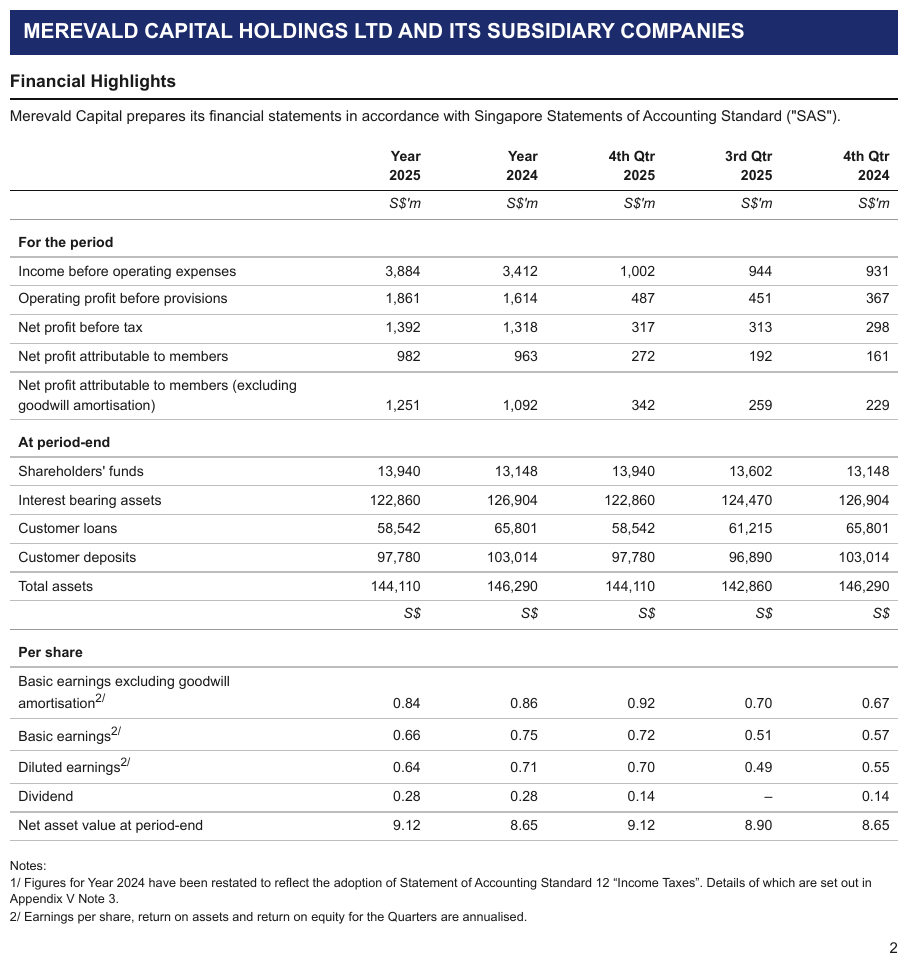
S$'m under the header, then a second units line — S$ in every column — printed mid-table before
the Per share block. A units line between two blocks of body is a band row: every cell a
<th>, the S$ cells included, never a body row and never a table split. Both units lines are
italic.
Source page
Expected output · excerpt
| Year 2025 | Year 2024 | 4th Qtr 2025 | 3rd Qtr 2025 | 4th Qtr 2024 | ||||||||||||||||||||||||||||||||||||||||||||||||||||||||||||||||||||||||||||||||||||||||||||||
|---|---|---|---|---|---|---|---|---|---|---|---|---|---|---|---|---|---|---|---|---|---|---|---|---|---|---|---|---|---|---|---|---|---|---|---|---|---|---|---|---|---|---|---|---|---|---|---|---|---|---|---|---|---|---|---|---|---|---|---|---|---|---|---|---|---|---|---|---|---|---|---|---|---|---|---|---|---|---|---|---|---|---|---|---|---|---|---|---|---|---|---|---|---|---|---|---|---|---|
| S$'m | S$'m | S$'m | S$'m | S$'m | ||||||||||||||||||||||||||||||||||||||||||||||||||||||||||||||||||||||||||||||||||||||||||||||
| For the period | ||||||||||||||||||||||||||||||||||||||||||||||||||||||||||||||||||||||||||||||||||||||||||||||||||
| Income before operating expenses | 3,884 | 3,412 | 1,002 | 944 | 931 | |||||||||||||||||||||||||||||||||||||||||||||||||||||||||||||||||||||||||||||||||||||||||||||
| … | ||||||||||||||||||||||||||||||||||||||||||||||||||||||||||||||||||||||||||||||||||||||||||||||||||
| Total assets | 144,110 | 146,290 | 144,110 | 142,860 | 146,290 | |||||||||||||||||||||||||||||||||||||||||||||||||||||||||||||||||||||||||||||||||||||||||||||
| S$ | S$ | S$ | S$ | S$ | ||||||||||||||||||||||||||||||||||||||||||||||||||||||||||||||||||||||||||||||||||||||||||||||
| Per share | ||||||||||||||||||||||||||||||||||||||||||||||||||||||||||||||||||||||||||||||||||||||||||||||||||
| Basic earnings excluding goodwill amortisation2/ | 0.84 | 0.86 | 0.92 | 0.70 | 0.67 | |||||||||||||||||||||||||||||||||||||||||||||||||||||||||||||||||||||||||||||||||||||||||||||
| Basic earnings2/ | 0.66 | 0.75 | 0.72 | 0.51 | 0.57 | |||||||||||||||||||||||||||||||||||||||||||||||||||||||||||||||||||||||||||||||||||||||||||||
| Diluted earnings2/ | 0.64 | 0.71 | 0.70 | 0.49 | 0.55 | |||||||||||||||||||||||||||||||||||||||||||||||||||||||||||||||||||||||||||||||||||||||||||||
| Dividend | 0.28 | 0.28 | 0.14 | – | 0.14 | |||||||||||||||||||||||||||||||||||||||||||||||||||||||||||||||||||||||||||||||||||||||||||||
| Net asset value at period-end | 9.12 | 8.65 | 9.12 | 8.90 | 8.65 | |||||||||||||||||||||||||||||||||||||||||||||||||||||||||||||||||||||||||||||||||||||||||||||
Look-alike
Two similar pages that call for different decisions. Synthetic, for teaching the boundary.
A line of ($000) and (%) tokens. Header, body row, or a split?
Units row under the header
| Premium | Losses | Ratio |
|---|---|---|
| ($000) | ($000) | (%) |
| 1,204 | 887 | 73.6 |
A second header row, or folded into the labels. Never a body row.
Units line in the middle of the body
| 2024 | 2023 | |
|---|---|---|
| Net profit | 10,286 | 9,384 |
| S$ | S$ | S$ |
| Per share | 3.62 | 3.29 |
A band row, every cell a th. Never a split.
Look at the structure. What evidence changes the answer?
Neighbouring rules, and how they differ
More
Rule id tables-units-row · tables headers