Total and Subtotal Rows
A total row—what marks it as a total?
✅ NormativeSettled. The requirement holds as written.📄 Page ruleCan be applied from the page alone.Read §9.5.6 in the RFC ↗
In a total or subtotal row, the label cell MUST be a <th> and the value cells MUST stay <td>.
The label cell MUST carry the row's absolute level as data-level, read as for the stub
hierarchy — a top-level total is data-level="0". Label and values MUST be kept exactly as
printed, bold only where the page prints them bold.
When it applies
| iPhone          | 205,489 |
| Mac             |  29,357 |
| **Total**       | 234,846 |   ← bold + a double rule above it
Reading the examples. Each one pairs a source page with the output the rule expects. ✅ Sample: the rule applies. ❌ Counter-sample: it looks like it applies and does not, or a rendering got it wrong. A non-conforming output, in red, is shown only for contrast. … marks content left out of an excerpt.
The rendering
<tr><td data-level="1">iPhone</td><td>205,489</td></tr>
<tr><td data-level="1">Mac</td><td>29,357</td></tr>
<tr><th data-level="0">Total</th><td>234,846</td></tr>
- The
<th>states that the cell labels rather than reports. data-levelrecords the printed absolute indentation of the label, counted from the left edge of the stub as in Row-Label Hierarchy (§9.5.5); because a total carries a level, every label cell of its stub carries one too.- The level MUST be the printed one even where it contradicts the apparent grouping — a total set further right than the items it sums keeps that deeper level. Arithmetic membership MUST NOT be inferred from indentation, and indentation MUST NOT be adjusted to fit the arithmetic.
- A total row whose label position prints nothing has no label cell to mark: it MUST be rendered
with an empty
<td></td>there — never an inventedTotaland never an empty<th>.
A <th> is a per-cell decision
A row can be part header, part data, and a total row is exactly that: a heading cell on the left
and reported values to its right. Marking the whole row <th> would claim the numbers are headings;
marking none of it loses the distinction between the cell that names the aggregate and the cells
that report it. Both are non-conforming.
The same holds in reverse for a full-width band or divider row, where every cell is heading and none is data — see Bands Inside the Grid (§9.2.1) and Titles Banners Captions (§9.7.3).
Recognising one
A total or subtotal row usually carries three tells at once: a label that names an aggregate ("Total", "Total net sales", "5 YR. TOTAL"), a rule or double rule printed above it, and bold or otherwise emphasised type. Any one alone is weak evidence — bold is applied unreliably in both directions (Bold and Italic Inside Tables (§9.6.2)) — but together they are reliable.
Several boldwarn
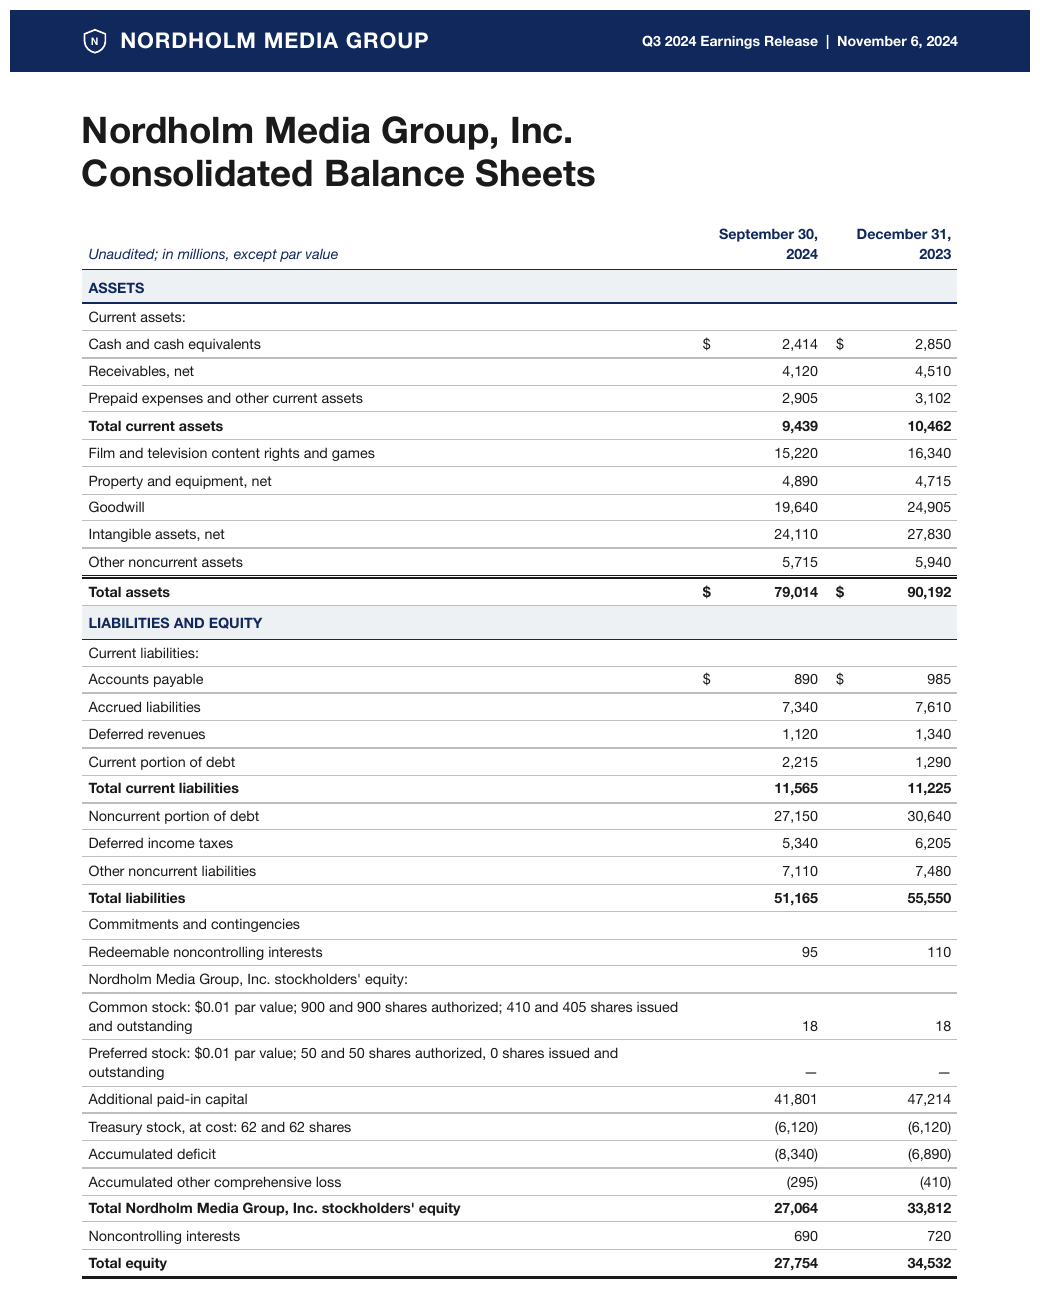
Several bold, ruled totals in one balance sheet — Total current assets, Total assets, Total
current liabilities, Total liabilities, Total … stockholders' equity, Total equity. No label
is indented, so every level is 0. The italic stub heading is not bold.
Source page
Expected output · excerpt
| Unaudited; in millions, except par value | September 30, 2024 | December 31, 2023 | ||||||||||||||||||||||||||||||||||||||||||||||||||||||||||||||||||||||||||||||||||||||||||||||||
|---|---|---|---|---|---|---|---|---|---|---|---|---|---|---|---|---|---|---|---|---|---|---|---|---|---|---|---|---|---|---|---|---|---|---|---|---|---|---|---|---|---|---|---|---|---|---|---|---|---|---|---|---|---|---|---|---|---|---|---|---|---|---|---|---|---|---|---|---|---|---|---|---|---|---|---|---|---|---|---|---|---|---|---|---|---|---|---|---|---|---|---|---|---|---|---|---|---|---|
| ASSETS | ||||||||||||||||||||||||||||||||||||||||||||||||||||||||||||||||||||||||||||||||||||||||||||||||||
| Current assets: | ||||||||||||||||||||||||||||||||||||||||||||||||||||||||||||||||||||||||||||||||||||||||||||||||||
| Cash and cash equivalents | $2,414 | $2,850 | ||||||||||||||||||||||||||||||||||||||||||||||||||||||||||||||||||||||||||||||||||||||||||||||||
| Receivables, net | 4,120 | 4,510 | ||||||||||||||||||||||||||||||||||||||||||||||||||||||||||||||||||||||||||||||||||||||||||||||||
| Prepaid expenses and other current assets | 2,905 | 3,102 | ||||||||||||||||||||||||||||||||||||||||||||||||||||||||||||||||||||||||||||||||||||||||||||||||
| Total current assets | 9,439 | 10,462 | ||||||||||||||||||||||||||||||||||||||||||||||||||||||||||||||||||||||||||||||||||||||||||||||||
| Film and television content rights and games | 15,220 | 16,340 | ||||||||||||||||||||||||||||||||||||||||||||||||||||||||||||||||||||||||||||||||||||||||||||||||
| Property and equipment, net | 4,890 | 4,715 | ||||||||||||||||||||||||||||||||||||||||||||||||||||||||||||||||||||||||||||||||||||||||||||||||
| Goodwill | 19,640 | 24,905 | ||||||||||||||||||||||||||||||||||||||||||||||||||||||||||||||||||||||||||||||||||||||||||||||||
| Intangible assets, net | 24,110 | 27,830 | ||||||||||||||||||||||||||||||||||||||||||||||||||||||||||||||||||||||||||||||||||||||||||||||||
| Other noncurrent assets | 5,715 | 5,940 | ||||||||||||||||||||||||||||||||||||||||||||||||||||||||||||||||||||||||||||||||||||||||||||||||
| Total assets | $79,014 | $90,192 | ||||||||||||||||||||||||||||||||||||||||||||||||||||||||||||||||||||||||||||||||||||||||||||||||
| LIABILITIES AND EQUITY | ||||||||||||||||||||||||||||||||||||||||||||||||||||||||||||||||||||||||||||||||||||||||||||||||||
| … | ||||||||||||||||||||||||||||||||||||||||||||||||||||||||||||||||||||||||||||||||||||||||||||||||||
| Total Nordholm Media Group, Inc. stockholders' equity | 27,064 | 33,812 | ||||||||||||||||||||||||||||||||||||||||||||||||||||||||||||||||||||||||||||||||||||||||||||||||
| Noncontrolling interests | 690 | 720 | ||||||||||||||||||||||||||||||||||||||||||||||||||||||||||||||||||||||||||||||||||||||||||||||||
| Total equity | 27,754 | 34,532 | ||||||||||||||||||||||||||||||||||||||||||||||||||||||||||||||||||||||||||||||||||||||||||||||||
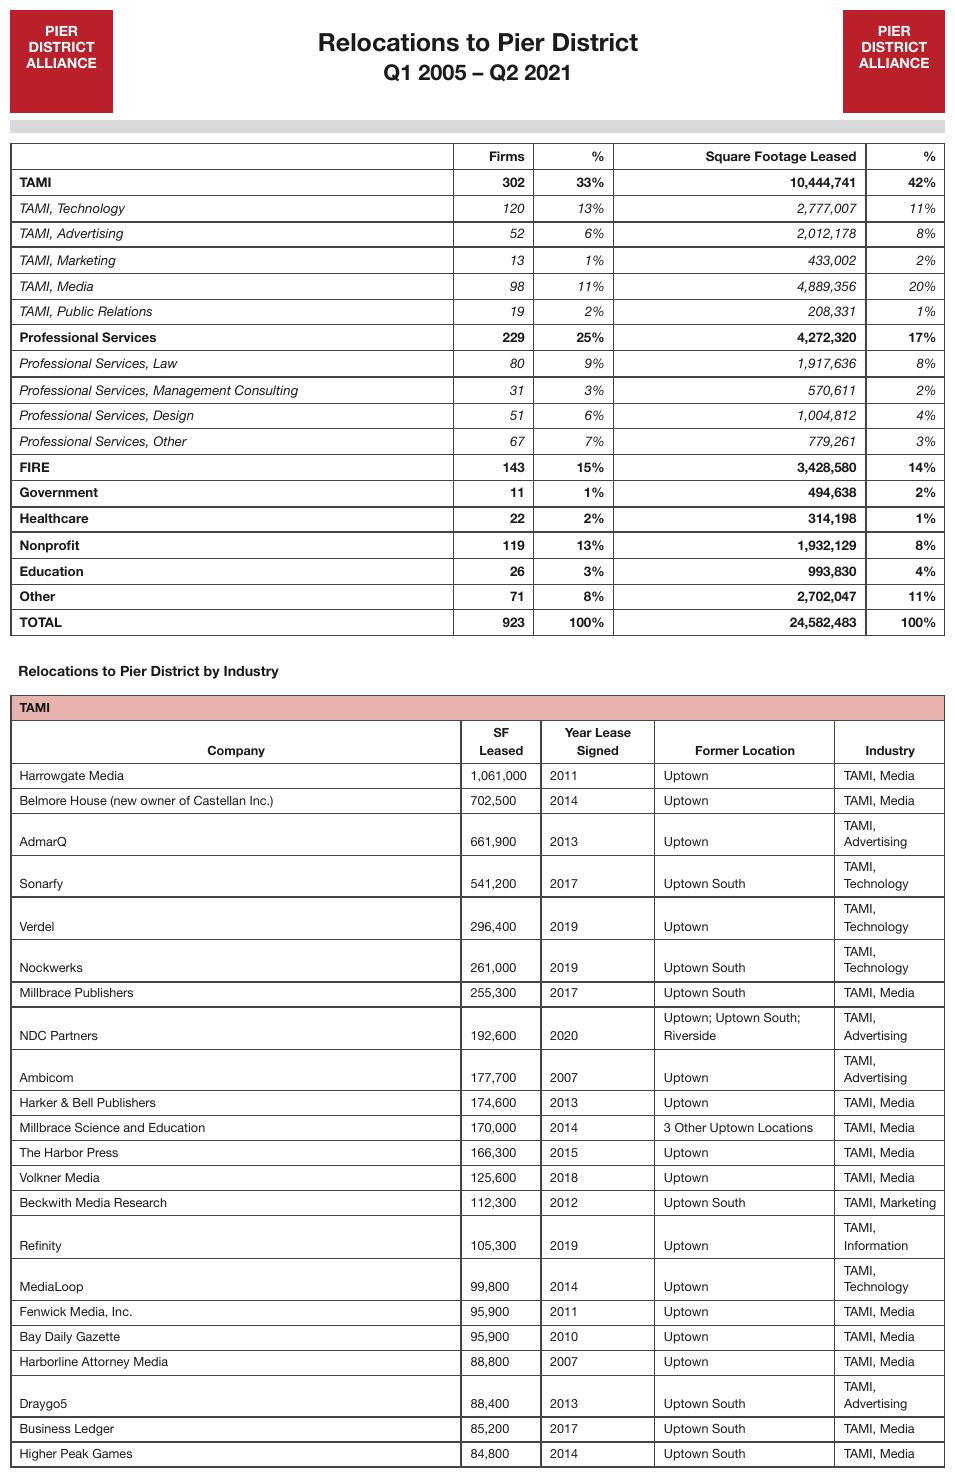
A bold, ruled TOTAL row closes the relocation summary (923 · 100% · 24,582,483 · 100%)dt1
A bold, ruled TOTAL row closes the relocation summary (923 · 100% · 24,582,483 · 100%).
Source page
Expected output · table 1 of 2, excerpt
| Firms | % | Square Footage Leased | % | |||||||||||||||||||||||||||||||||||||||||||||||||||||||||||||||||||||||||||||||||||||||||||||||
|---|---|---|---|---|---|---|---|---|---|---|---|---|---|---|---|---|---|---|---|---|---|---|---|---|---|---|---|---|---|---|---|---|---|---|---|---|---|---|---|---|---|---|---|---|---|---|---|---|---|---|---|---|---|---|---|---|---|---|---|---|---|---|---|---|---|---|---|---|---|---|---|---|---|---|---|---|---|---|---|---|---|---|---|---|---|---|---|---|---|---|---|---|---|---|---|---|---|---|
| … | ||||||||||||||||||||||||||||||||||||||||||||||||||||||||||||||||||||||||||||||||||||||||||||||||||
| Other | 71 | 8% | 2,702,047 | 11% | ||||||||||||||||||||||||||||||||||||||||||||||||||||||||||||||||||||||||||||||||||||||||||||||
| TOTAL | 923 | 100% | 24,582,483 | 100% | ||||||||||||||||||||||||||||||||||||||||||||||||||||||||||||||||||||||||||||||||||||||||||||||
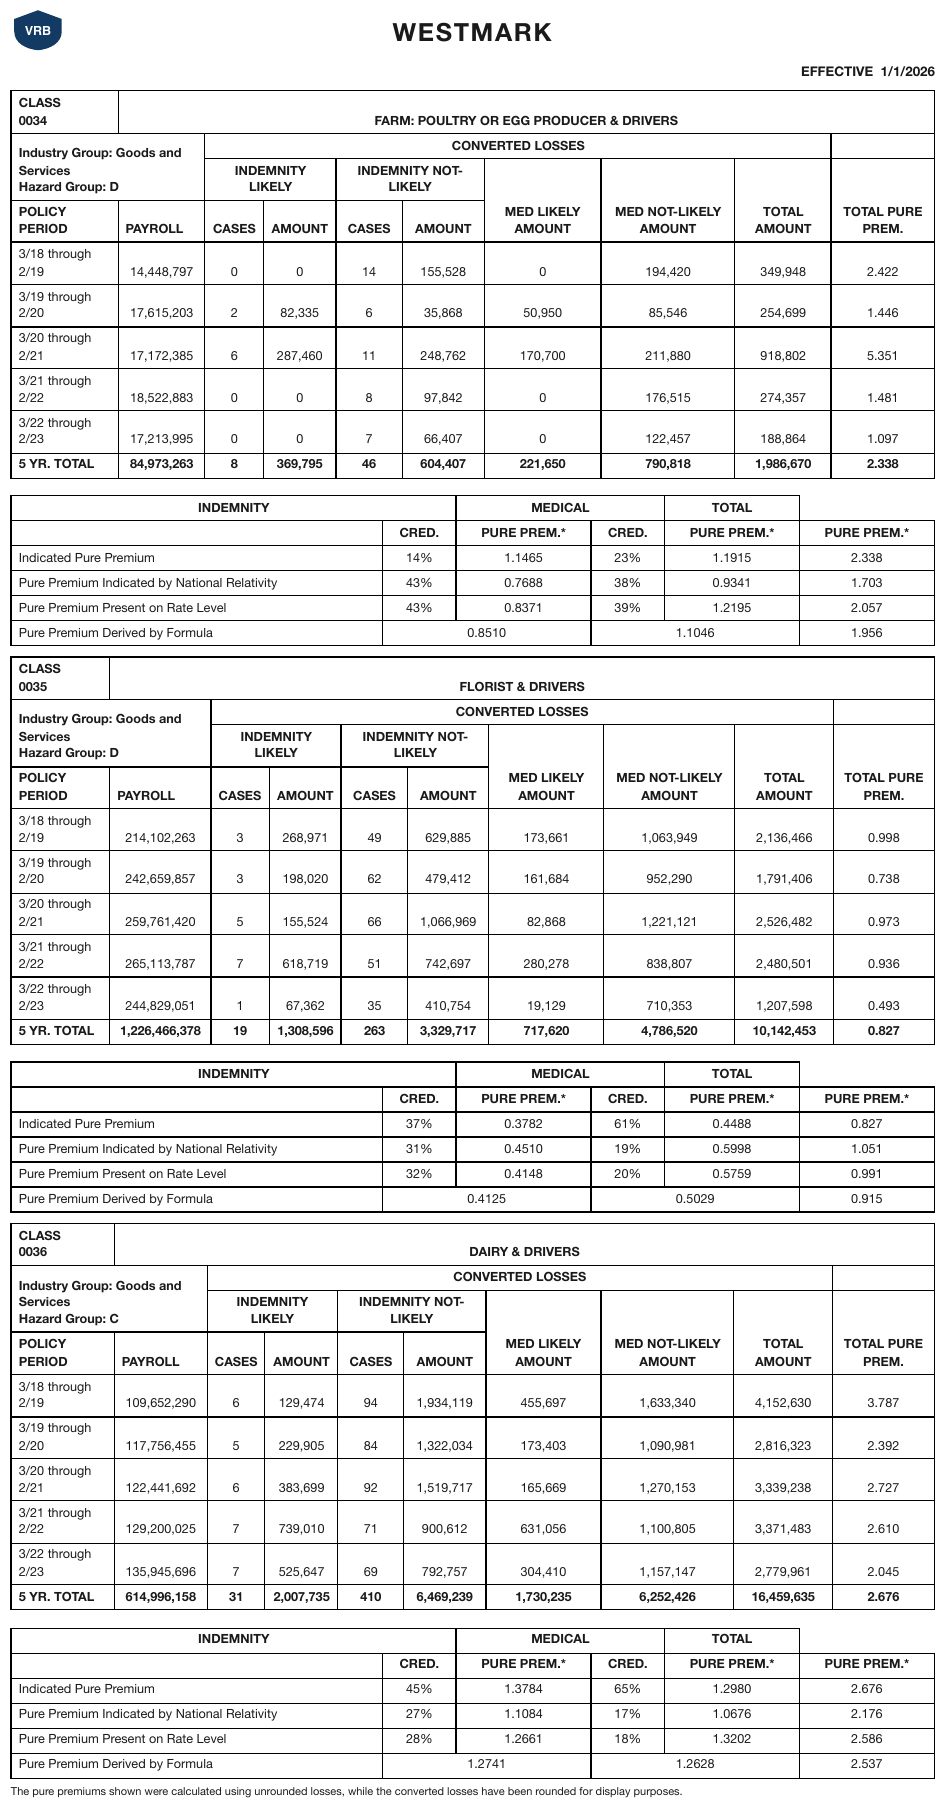
A bold 5 YR3tables2
TOTAL row closes each class block. Each class block and the credibility grid under it are separately framed with a gap between them, so they are separate tables; the first class block is shown.
Source page
Expected output · table 1 of 6
| CLASS 0034 | FARM: POULTRY OR EGG PRODUCER & DRIVERS | ||||||||
|---|---|---|---|---|---|---|---|---|---|
| Industry Group: Goods and Services Hazard Group: D | CONVERTED LOSSES | ||||||||
| INDEMNITY LIKELY | INDEMNITY NOT-LIKELY | MED LIKELY AMOUNT | MED NOT-LIKELY AMOUNT | TOTAL AMOUNT | TOTAL PURE PREM. | ||||
| POLICY PERIOD | PAYROLL | CASES | AMOUNT | CASES | AMOUNT | ||||
| 3/18 through 2/19 | 14,448,797 | 0 | 0 | 14 | 155,528 | 0 | 194,420 | 349,948 | 2.422 |
| 3/19 through 2/20 | 17,615,203 | 2 | 82,335 | 6 | 35,868 | 50,950 | 85,546 | 254,699 | 1.446 |
| 3/20 through 2/21 | 17,172,385 | 6 | 287,460 | 11 | 248,762 | 170,700 | 211,880 | 918,802 | 5.351 |
| 3/21 through 2/22 | 18,522,883 | 0 | 0 | 8 | 97,842 | 0 | 176,515 | 274,357 | 1.481 |
| 3/22 through 2/23 | 17,213,995 | 0 | 0 | 7 | 66,407 | 0 | 122,457 | 188,864 | 1.097 |
| 5 YR. TOTAL | 84,973,263 | 8 | 369,795 | 46 | 604,407 | 221,650 | 790,818 | 1,986,670 | 2.338 |
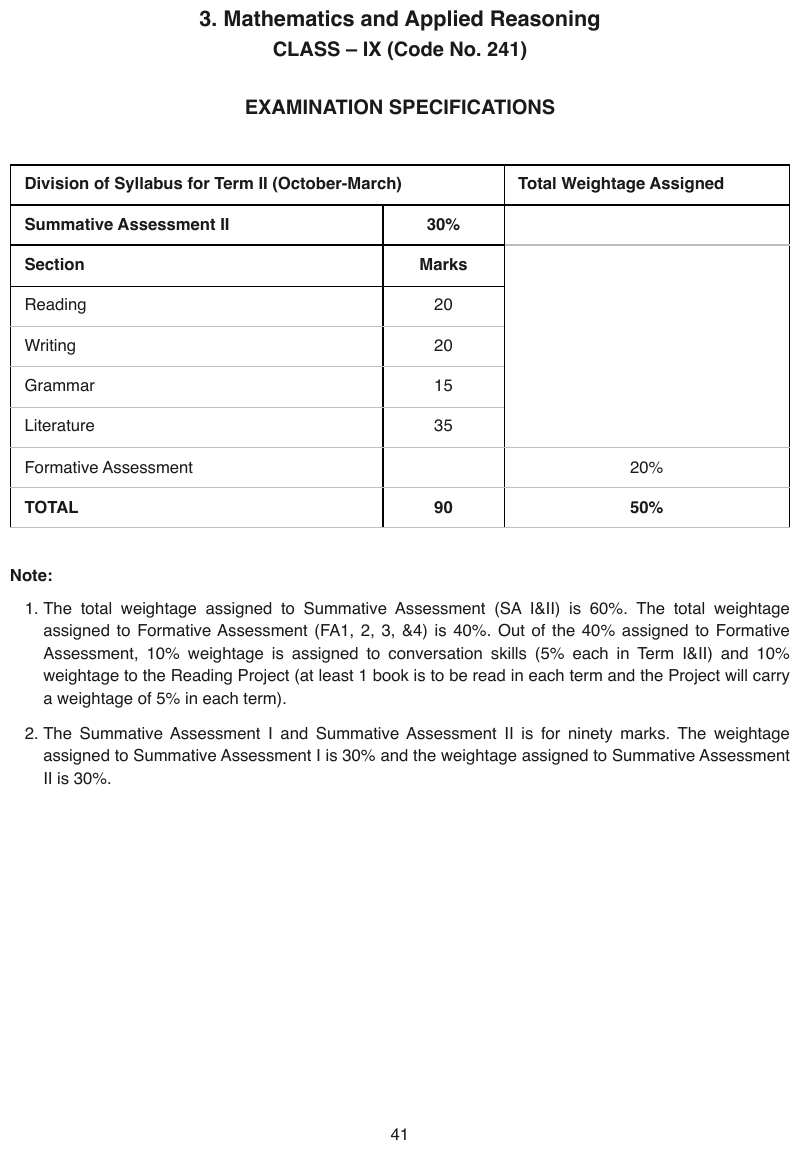
A bold, ruled TOTAL 90 50% row closes the weightage tableen
A bold, ruled TOTAL 90 50% row closes the weightage table.
Source page
Expected output
| Division of Syllabus for Term II (October-March) | Total Weightage Assigned | |
|---|---|---|
| Summative Assessment II | 30% | |
| Section | Marks | |
| Reading | 20 | |
| Writing | 20 | |
| Grammar | 15 | |
| Literature | 35 | |
| Formative Assessment | 20% | |
| TOTAL | 90 | 50% |
A bold 1997-2017 summary row under a rule closes each cohort block3t
its label names the whole vintage range the rows above divide up.
Source page
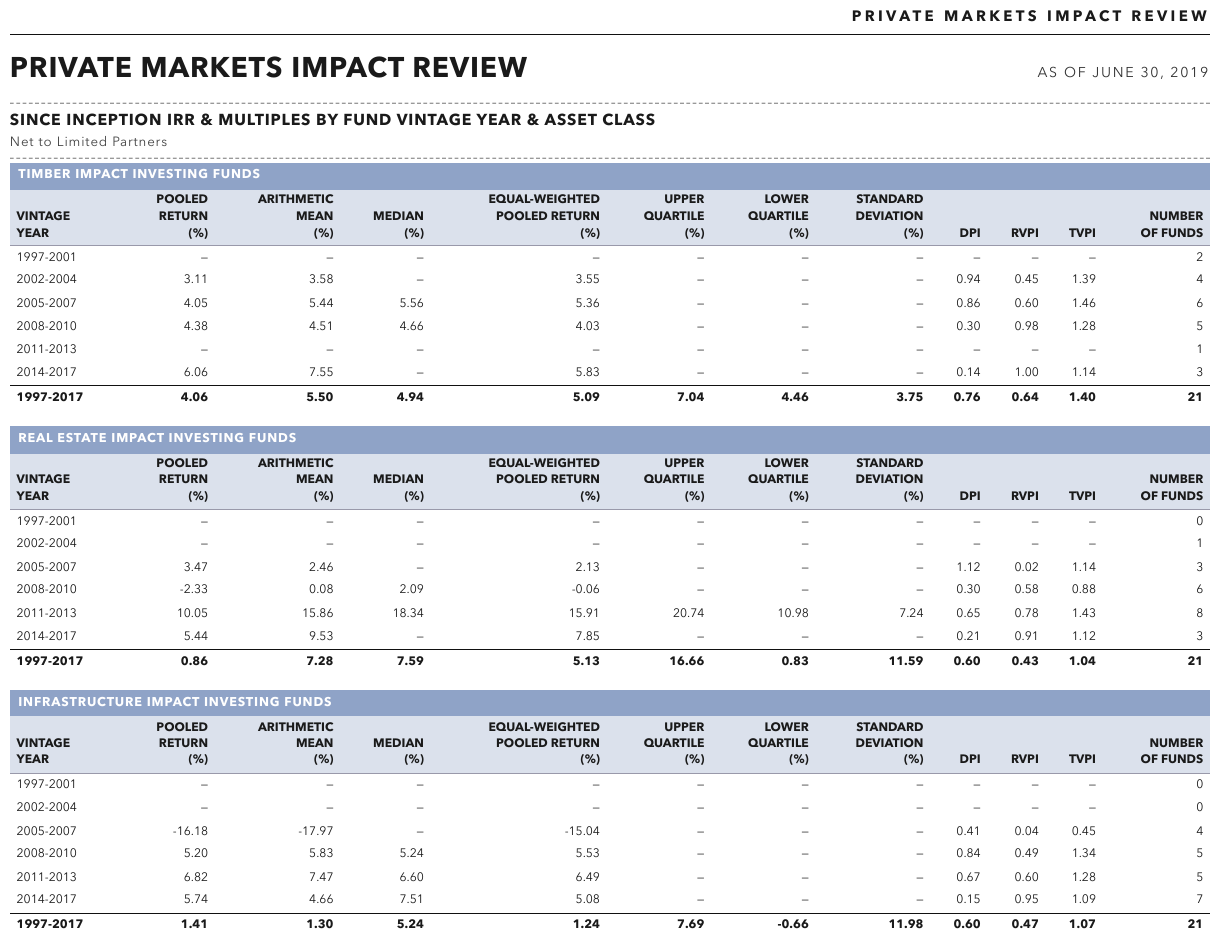
Expected output · table 1 of 3
| TIMBER IMPACT INVESTING FUNDS | |||||||||||
|---|---|---|---|---|---|---|---|---|---|---|---|
| VINTAGE YEAR | POOLED RETURN (%) | ARITHMETIC MEAN (%) | MEDIAN (%) | EQUAL-WEIGHTED POOLED RETURN (%) | UPPER QUARTILE (%) | LOWER QUARTILE (%) | STANDARD DEVIATION (%) | DPI | RVPI | TVPI | NUMBER OF FUNDS |
| 1997-2001 | — | — | — | — | — | — | — | — | — | — | 2 |
| 2002-2004 | 3.11 | 3.58 | — | 3.55 | — | — | — | 0.94 | 0.45 | 1.39 | 4 |
| 2005-2007 | 4.05 | 5.44 | 5.56 | 5.36 | — | — | — | 0.86 | 0.60 | 1.46 | 6 |
| 2008-2010 | 4.38 | 4.51 | 4.66 | 4.03 | — | — | — | 0.30 | 0.98 | 1.28 | 5 |
| 2011-2013 | — | — | — | — | — | — | — | — | — | — | 1 |
| 2014-2017 | 6.06 | 7.55 | — | 5.83 | — | — | — | 0.14 | 1.00 | 1.14 | 3 |
| 1997-2017 | 4.06 | 5.50 | 4.94 | 5.09 | 7.04 | 4.46 | 3.75 | 0.76 | 0.64 | 1.40 | 21 |
Row order and table sections
- Every row MUST stay in printed order. A total MUST NOT be moved to fit a table section.
<thead>,<tbody>and<tfoot>wrappers MAY be used or omitted; they do not change the cells or their values, andthversustdis still decided per cell.- Totals printed outside the table frame are governed by Bottom Edge Totals and Islands (§9.7.1).
More shapes
a total row with no label at all
The taxation table closes with 834 / 752 under a rule, in bold, with an empty label cell:
nothing prints where Total would go. The label cell is <td></td> — no label, so no <th> and no
invented Total. The rule and the bold are the only tells. The June 30, 2003 column is bold
throughout.
Source page
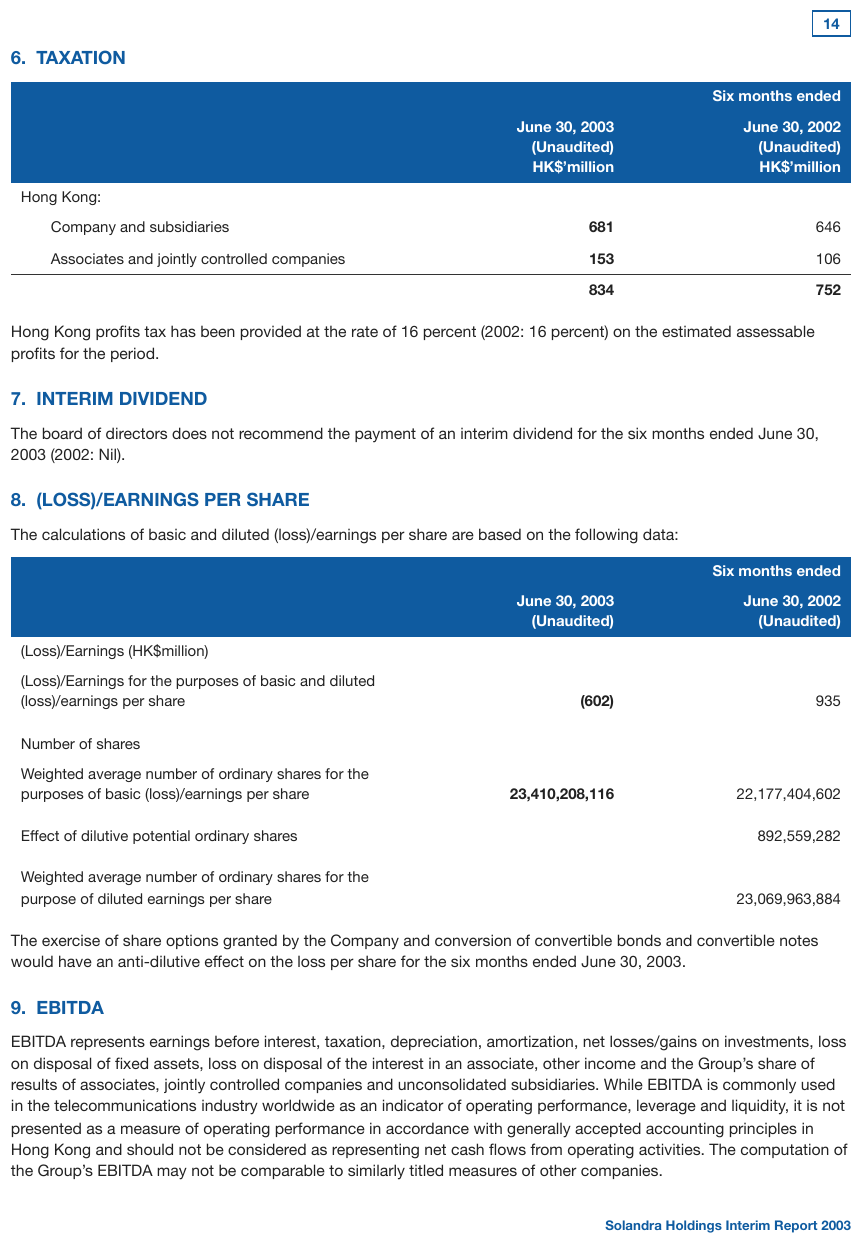
Expected output · table 1 of 2
| Six months ended | ||
|---|---|---|
| June 30, 2003 (Unaudited) HK$’million | June 30, 2002 (Unaudited) HK$’million | |
| Hong Kong: | ||
| Company and subsidiaries | 681 | 646 |
| Associates and jointly controlled companies | 153 | 106 |
| 834 | 752 | |
a total set further right than its children
Each Total is centred well to the right of the items it sums, twice on the page. Total other comprehensive income (loss) starts just right of the item labels and Comprehensive income
between the two. Read by where each label starts, the page has four label positions, levels 0
to 3, and every total is deeper than its children; those printed levels are kept.
Source page
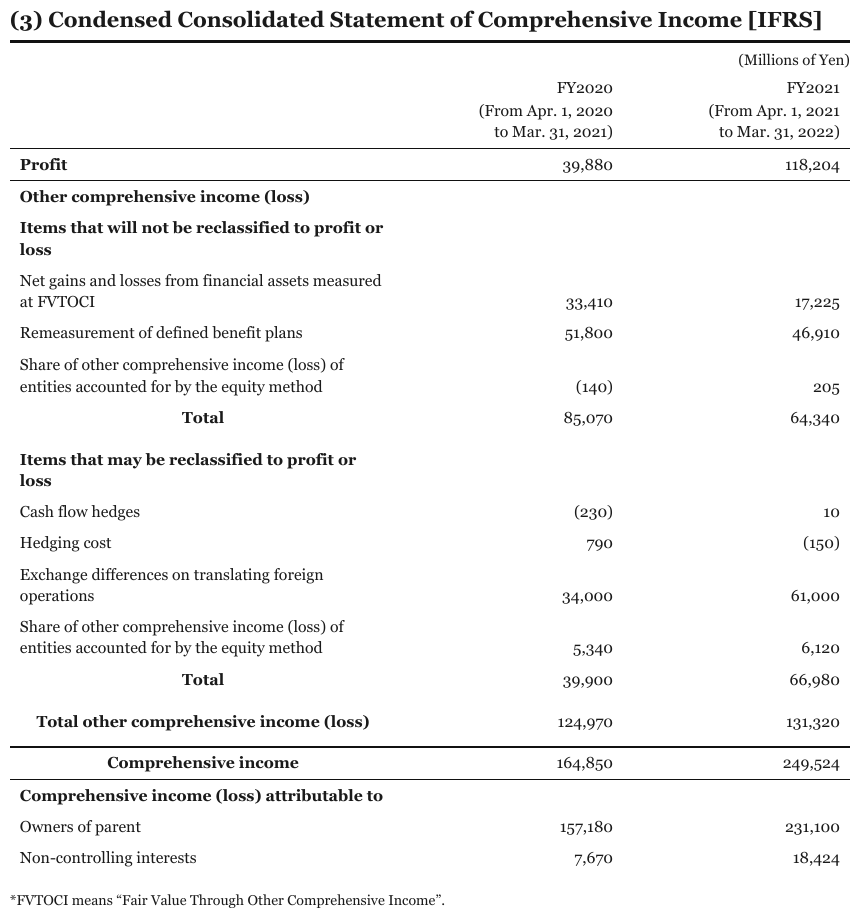
Expected output
| FY2020 (From Apr. 1, 2020 to Mar. 31, 2021) | FY2021 (From Apr. 1, 2021 to Mar. 31, 2022) | |
|---|---|---|
| Profit | 39,880 | 118,204 |
| Other comprehensive income (loss) | ||
| Items that will not be reclassified to profit or loss | ||
| Net gains and losses from financial assets measured at FVTOCI | 33,410 | 17,225 |
| Remeasurement of defined benefit plans | 51,800 | 46,910 |
| Share of other comprehensive income (loss) of entities accounted for by the equity method | (140) | 205 |
| Total | 85,070 | 64,340 |
| Items that may be reclassified to profit or loss | ||
| Cash flow hedges | (230) | 10 |
| Hedging cost | 790 | (150) |
| Exchange differences on translating foreign operations | 34,000 | 61,000 |
| Share of other comprehensive income (loss) of entities accounted for by the equity method | 5,340 | 6,120 |
| Total | 39,900 | 66,980 |
| Total other comprehensive income (loss) | 124,970 | 131,320 |
| Comprehensive income | 164,850 | 249,524 |
| Comprehensive income (loss) attributable to | ||
| Owners of parent | 157,180 | 231,100 |
| Non-controlling interests | 7,670 | 18,424 |
rows printed after the total that it does not include
Total closes the Global Sales Volume block, then USA and Australia follow at the same
indent as Japan and Europe. They are memo lines — USA sits inside North America — not
components of the total. They stay in the same table, in printed order, at the level their indent
prints; splitting them off into a second table is non-conforming.
Source page
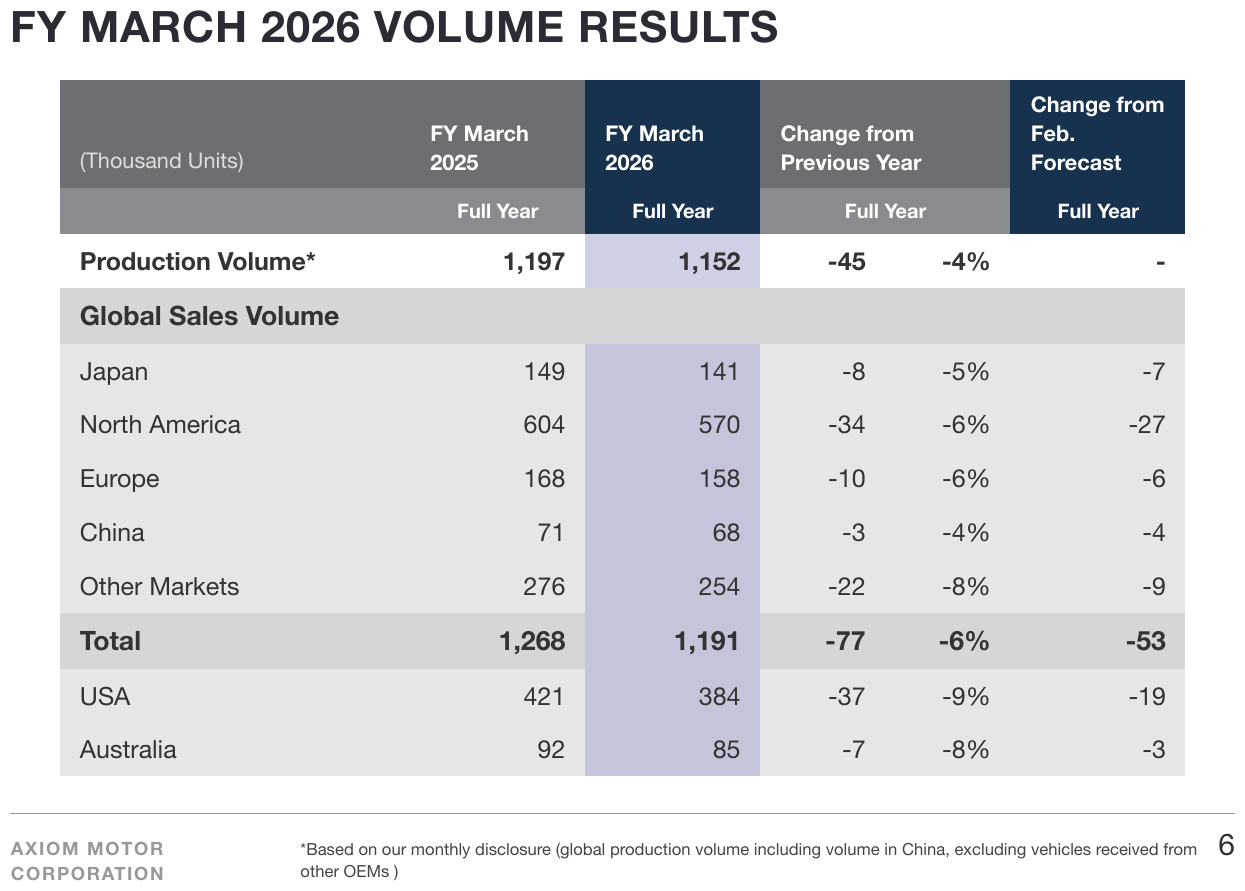
Expected output
| (Thousand Units) | FY March 2025 | FY March 2026 | Change from Previous Year | Change from Feb. Forecast | |
|---|---|---|---|---|---|
| Full Year | Full Year | Full Year | Full Year | ||
| Production Volume* | 1,197 | 1,152 | -45 | -4% | - |
| Global Sales Volume | |||||
| Japan | 149 | 141 | -8 | -5% | -7 |
| North America | 604 | 570 | -34 | -6% | -27 |
| Europe | 168 | 158 | -10 | -6% | -6 |
| China | 71 | 68 | -3 | -4% | -4 |
| Other Markets | 276 | 254 | -22 | -8% | -9 |
| Total | 1,268 | 1,191 | -77 | -6% | -53 |
| USA | 421 | 384 | -37 | -9% | -19 |
| Australia | 92 | 85 | -7 | -8% | -3 |
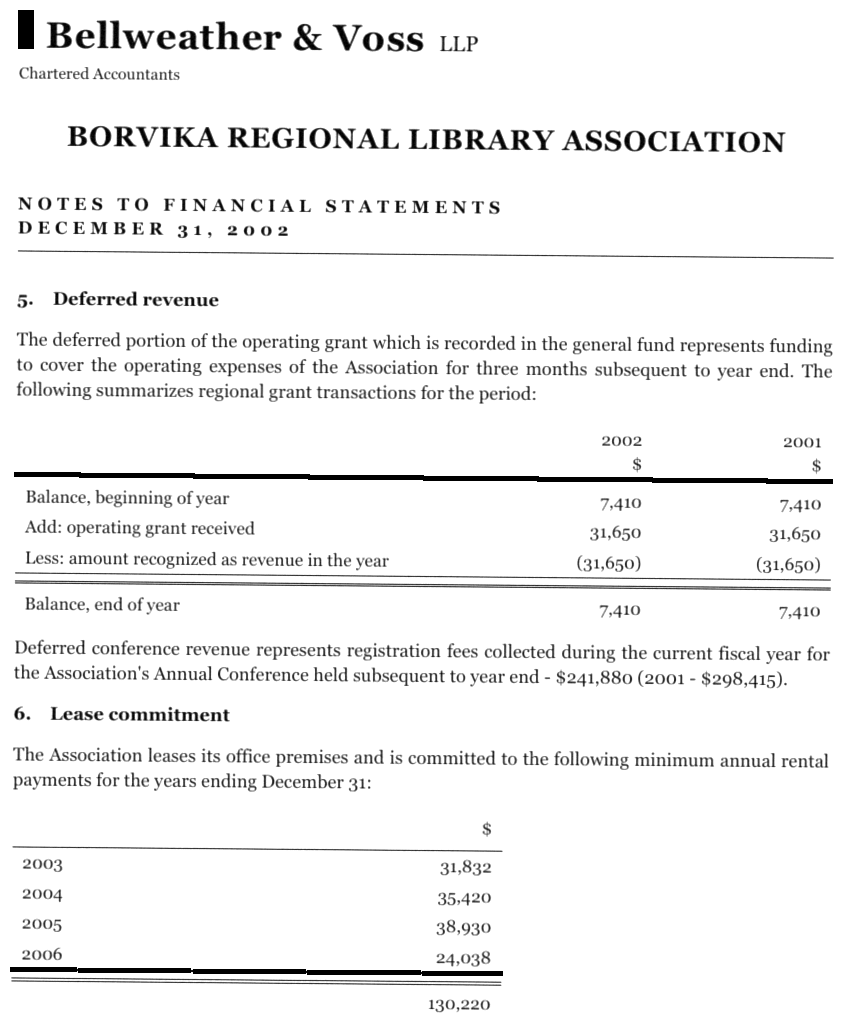
a scanned lease table with an unlabelled total
Note 6: four years and four amounts under a lone $ header, then 130,220 under a double rule,
with no label at all — so its label cell is empty. Note 5 above it is a borderless statement whose
Balance, end of year total sits under a double rule, not bold. The printed rules are not rows.
Source page
Expected output · notes 5 and 6
| 2002 $ | 2001 $ | |
|---|---|---|
| Balance, beginning of year | 7,410 | 7,410 |
| Add: operating grant received | 31,650 | 31,650 |
| Less: amount recognized as revenue in the year | (31,650) | (31,650) |
| Balance, end of year | 7,410 | 7,410 |
…
| $ | |
|---|---|
| 2003 | 31,832 |
| 2004 | 35,420 |
| 2005 | 38,930 |
| 2006 | 24,038 |
| 130,220 |
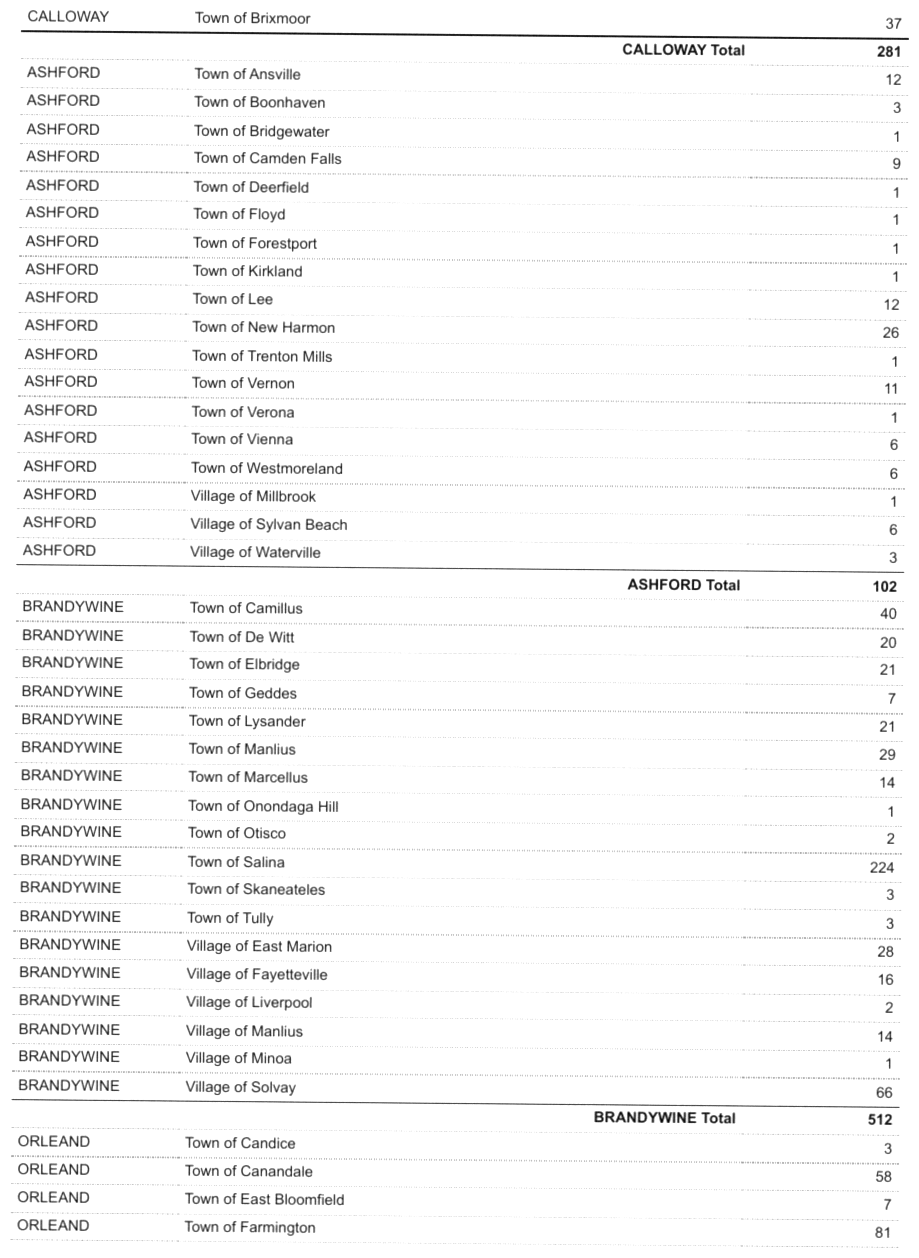
a total label printed in the town column
A county / municipality / count list continued from an earlier page. Each ASHFORD Total,
BRANDYWINE Total label is set in bold, right-aligned inside the municipality column, with the sum
in the count column. The label stays in that column as a <th>; it starts to the right of the
municipality names, so its level is 1.
Source page
Expected output · excerpt
| CALLOWAY | Town of Brixmoor | 37 | ||||||||||||||||||||||||||||||||||||||||||||||||||||||||||||||||||||||||||||||||||||||||||||||||
| CALLOWAY Total | 281 | |||||||||||||||||||||||||||||||||||||||||||||||||||||||||||||||||||||||||||||||||||||||||||||||||
|---|---|---|---|---|---|---|---|---|---|---|---|---|---|---|---|---|---|---|---|---|---|---|---|---|---|---|---|---|---|---|---|---|---|---|---|---|---|---|---|---|---|---|---|---|---|---|---|---|---|---|---|---|---|---|---|---|---|---|---|---|---|---|---|---|---|---|---|---|---|---|---|---|---|---|---|---|---|---|---|---|---|---|---|---|---|---|---|---|---|---|---|---|---|---|---|---|---|---|
| ASHFORD | Town of Ansville | 12 | ||||||||||||||||||||||||||||||||||||||||||||||||||||||||||||||||||||||||||||||||||||||||||||||||
| ASHFORD | Town of Boonhaven | 3 | ||||||||||||||||||||||||||||||||||||||||||||||||||||||||||||||||||||||||||||||||||||||||||||||||
| … | ||||||||||||||||||||||||||||||||||||||||||||||||||||||||||||||||||||||||||||||||||||||||||||||||||
| ASHFORD | Village of Waterville | 3 | ||||||||||||||||||||||||||||||||||||||||||||||||||||||||||||||||||||||||||||||||||||||||||||||||
| ASHFORD Total | 102 | |||||||||||||||||||||||||||||||||||||||||||||||||||||||||||||||||||||||||||||||||||||||||||||||||
| BRANDYWINE | Town of Camillus | 40 | ||||||||||||||||||||||||||||||||||||||||||||||||||||||||||||||||||||||||||||||||||||||||||||||||
| … | ||||||||||||||||||||||||||||||||||||||||||||||||||||||||||||||||||||||||||||||||||||||||||||||||||
| BRANDYWINE | Village of Solvay | 66 | ||||||||||||||||||||||||||||||||||||||||||||||||||||||||||||||||||||||||||||||||||||||||||||||||
| BRANDYWINE Total | 512 | |||||||||||||||||||||||||||||||||||||||||||||||||||||||||||||||||||||||||||||||||||||||||||||||||
| ORLEAND | Town of Candice | 3 | ||||||||||||||||||||||||||||||||||||||||||||||||||||||||||||||||||||||||||||||||||||||||||||||||
| … | ||||||||||||||||||||||||||||||||||||||||||||||||||||||||||||||||||||||||||||||||||||||||||||||||||
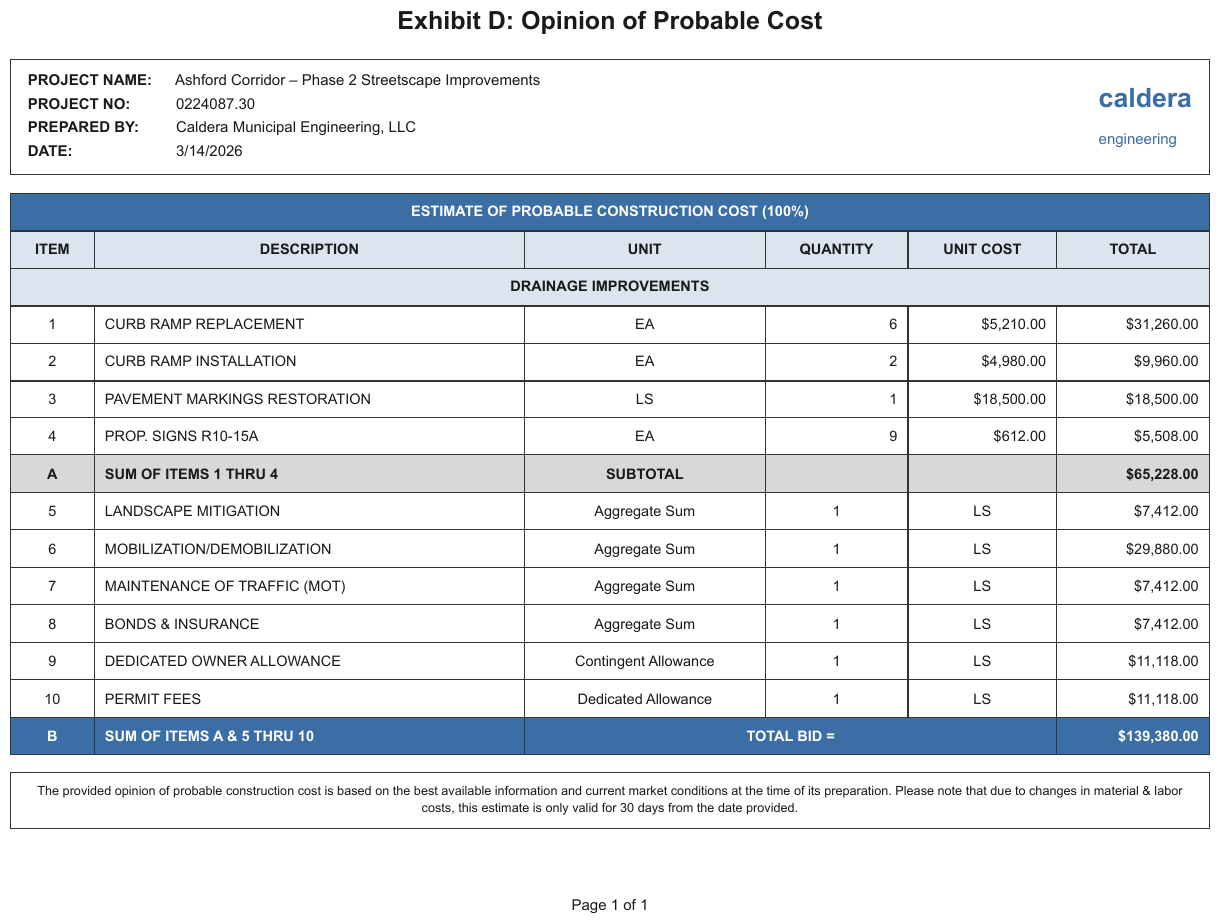
a subtotal label in the unit column
Row A prints SUM OF ITEMS 1 THRU 4 in the description column and SUBTOTAL in the UNIT
column, with the sum under TOTAL; row B prints TOTAL BID = in one cell spanning the unit,
quantity and unit-cost columns. The label is split across columns the page uses for other things;
each part stays in the column it is printed in, and the label cells are <th>.
Source page
Expected output · excerpt
| ESTIMATE OF PROBABLE CONSTRUCTION COST (100%) | ||||||||||||||||||||||||||||||||||||||||||||||||||||||||||||||||||||||||||||||||||||||||||||||||||
|---|---|---|---|---|---|---|---|---|---|---|---|---|---|---|---|---|---|---|---|---|---|---|---|---|---|---|---|---|---|---|---|---|---|---|---|---|---|---|---|---|---|---|---|---|---|---|---|---|---|---|---|---|---|---|---|---|---|---|---|---|---|---|---|---|---|---|---|---|---|---|---|---|---|---|---|---|---|---|---|---|---|---|---|---|---|---|---|---|---|---|---|---|---|---|---|---|---|---|
| ITEM | DESCRIPTION | UNIT | QUANTITY | UNIT COST | TOTAL | |||||||||||||||||||||||||||||||||||||||||||||||||||||||||||||||||||||||||||||||||||||||||||||
| DRAINAGE IMPROVEMENTS | ||||||||||||||||||||||||||||||||||||||||||||||||||||||||||||||||||||||||||||||||||||||||||||||||||
| 1 | CURB RAMP REPLACEMENT | EA | 6 | $5,210.00 | $31,260.00 | |||||||||||||||||||||||||||||||||||||||||||||||||||||||||||||||||||||||||||||||||||||||||||||
| … | ||||||||||||||||||||||||||||||||||||||||||||||||||||||||||||||||||||||||||||||||||||||||||||||||||
| 4 | PROP. SIGNS R10-15A | EA | 9 | $612.00 | $5,508.00 | |||||||||||||||||||||||||||||||||||||||||||||||||||||||||||||||||||||||||||||||||||||||||||||
| A | SUM OF ITEMS 1 THRU 4 | SUBTOTAL | $65,228.00 | |||||||||||||||||||||||||||||||||||||||||||||||||||||||||||||||||||||||||||||||||||||||||||||||
| 5 | LANDSCAPE MITIGATION | Aggregate Sum | 1 | LS | $7,412.00 | |||||||||||||||||||||||||||||||||||||||||||||||||||||||||||||||||||||||||||||||||||||||||||||
| … | ||||||||||||||||||||||||||||||||||||||||||||||||||||||||||||||||||||||||||||||||||||||||||||||||||
| 10 | PERMIT FEES | Dedicated Allowance | 1 | LS | $11,118.00 | |||||||||||||||||||||||||||||||||||||||||||||||||||||||||||||||||||||||||||||||||||||||||||||
| B | SUM OF ITEMS A & 5 THRU 10 | TOTAL BID = | $139,380.00 | |||||||||||||||||||||||||||||||||||||||||||||||||||||||||||||||||||||||||||||||||||||||||||||||
Neighbouring rules, and how they differ
More
Rule id tables-total-and-subtotal-rows · tables rule semantics rows