Geographic Maps
A map—is it data to tabulate or a picture to describe?
✅ NormativeSettled. The requirement holds as written.📄 Page ruleCan be applied from the page alone.Read §12.2.4 in the RFC ↗
How a map is rendered depends on what it is for. A data map whose values sit in drawn
regions MUST be rendered as a Region | Value table — the region names MAY be recognised from
the drawn outlines when the page does not print them, and the key column is then marked
data-recognised. A map of values placed only by position MUST be described, with its legend
transcribed, and no table. A map whose content is geography MUST be described. Every printed label
MUST be kept.
When it applies
A map appearing as a figure — typically a choropleth, or a labelled regional map.
Reading the examples. Each one pairs a source page with the output the rule expects. ✅ Sample: the rule applies. ❌ Counter-sample: it looks like it applies and does not, or a rendering got it wrong. A non-conforming output, in red, is shown only for contrast. … marks content left out of an excerpt.
The test
What the figure is carrying decides the rendering:
| The map is… | Rendering |
|---|---|
A data display wearing a costume — a shaded rate map is a Region \| Value table drawn on an outline; the geography is decoration, the numbers are the content |
An HTML <table data-source="chart">, region in one column and value in another, with the legend's units kept in the caption |
| Data placed only by position — readings plotted at points, identified by nothing but where they sit | A description with the legend transcribed; no table |
| A real map — routes, adjacency, borders, position relative to other features; flattening it to a table destroys the only information it carried | A description, with every printed label, legend entry and scale transcribed |
| Both — shaded values and meaningful geography, or it cannot be told which | The description and the table: two encodings lose nothing, picking one loses half the figure |
The key column
A table needs a key. When the regions carry no printed names, the key MAY be supplied by
recognising the drawn regions — Italian regions from their outlines, US states from theirs — but
only when every value sits inside one drawn, bounded region and the region is unambiguous to a
reader of the page. A recognised key is not printed text, so the table MUST say so: the header cell
of the key column carries the attribute data-recognised, and a header the page does not print is
worded after the map's own caption or legend.
<tr> <th data-recognised>Regione</th> <th>Prevalenza (%) …</th> </tr>
Values positioned only by coordinates — a scatter of point readings with no names — have no region to recognise. They MUST NOT be tabulated by coordinate; the map is described and its legend transcribed.
Whatever the rendering, the printed text of a map — title, caption, legend, labels, scale — MUST be kept (never drop).
Examples
a shaded rate map
A regional map of Italy shaded in three bands, one value printed in each region, a four-entry
legend and a caption. The geography is decoration; the values are the content, so the map is a
table. The map prints only values: each region is recognised from its outline, so the key column is marked
data-recognised, and its header follows the caption's wording. Basilicata is printed white (n.d.) with no value, so it has no
row; the caption states the gap. The table as it renders:
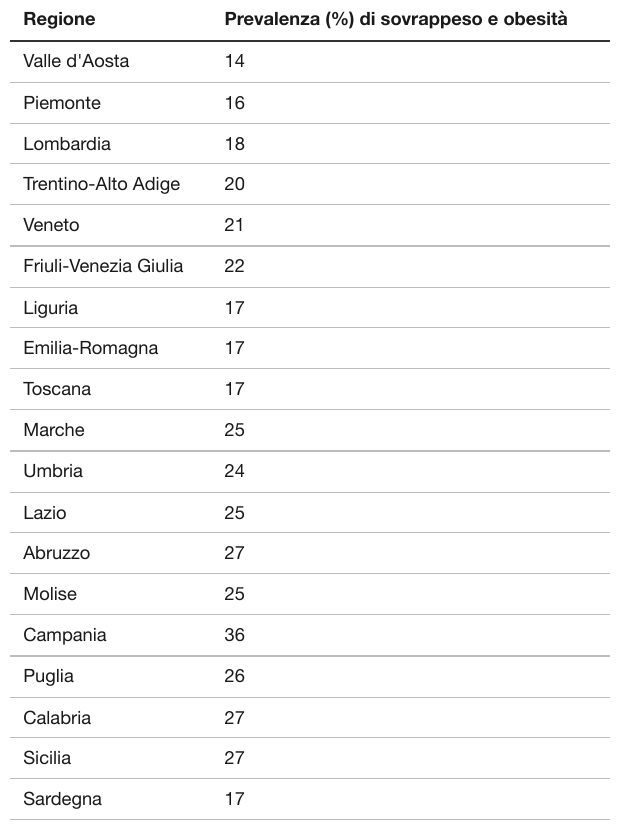
Source page
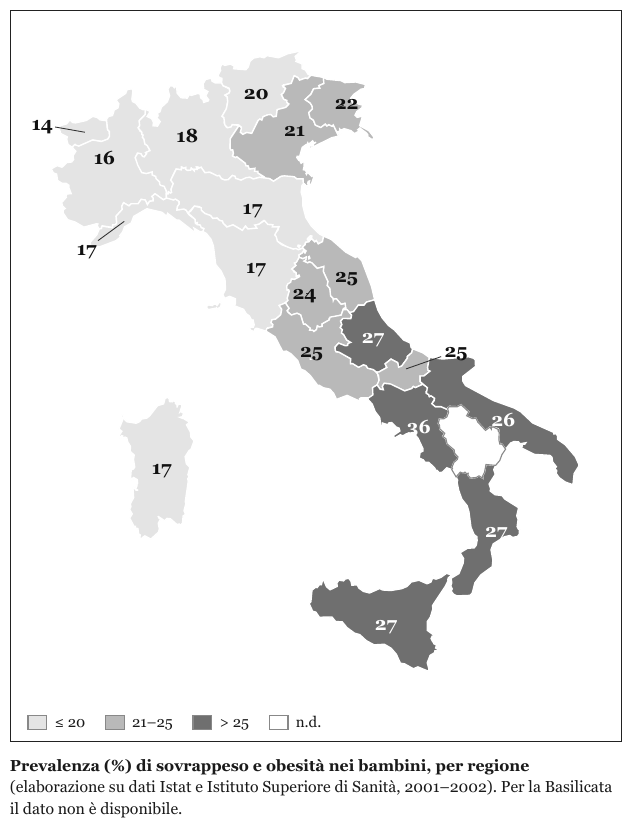
Expected output
| Regione | Prevalenza (%) di sovrappeso e obesità |
|---|---|
| Valle d'Aosta | 14 |
| Piemonte | 16 |
| Lombardia | 18 |
| Trentino-Alto Adige | 20 |
| Veneto | 21 |
| Friuli-Venezia Giulia | 22 |
| Liguria | 17 |
| Emilia-Romagna | 17 |
| Toscana | 17 |
| Marche | 25 |
| Umbria | 24 |
| Lazio | 25 |
| Abruzzo | 27 |
| Molise | 25 |
| Campania | 36 |
| Puglia | 26 |
| Calabria | 27 |
| Sicilia | 27 |
| Sardegna | 17 |
a map that is entirely data, with no printed key
An observed-precipitation map: state outlines, and on top of them a dense scatter of numeric readings, colour-coded by value.
Source: U.S. National Weather Service, Hydrometeorological Prediction Center — Observed 24-Hour Precipitation map (public domain)
This is a data display wearing a map, so the test says table. But it is also the case where that answer stops being practical: the readings are positioned by latitude and longitude with no station names printed, so there is no key column to put them in. The readings sit at points, not in drawn regions, so there is nothing to recognise as a key: the legend text is transcribed, the map is described, and no table is built.
The legend block in the top-left — title, valid time, sources and a red "Data not fully quality controlled" caveat — is printed text and MUST survive whatever is done with the plotted values. The red colour is emphasis, not a value, and is not carried. The plotted readings are too small to transcribe reliably at this resolution and are not listed.
Source page
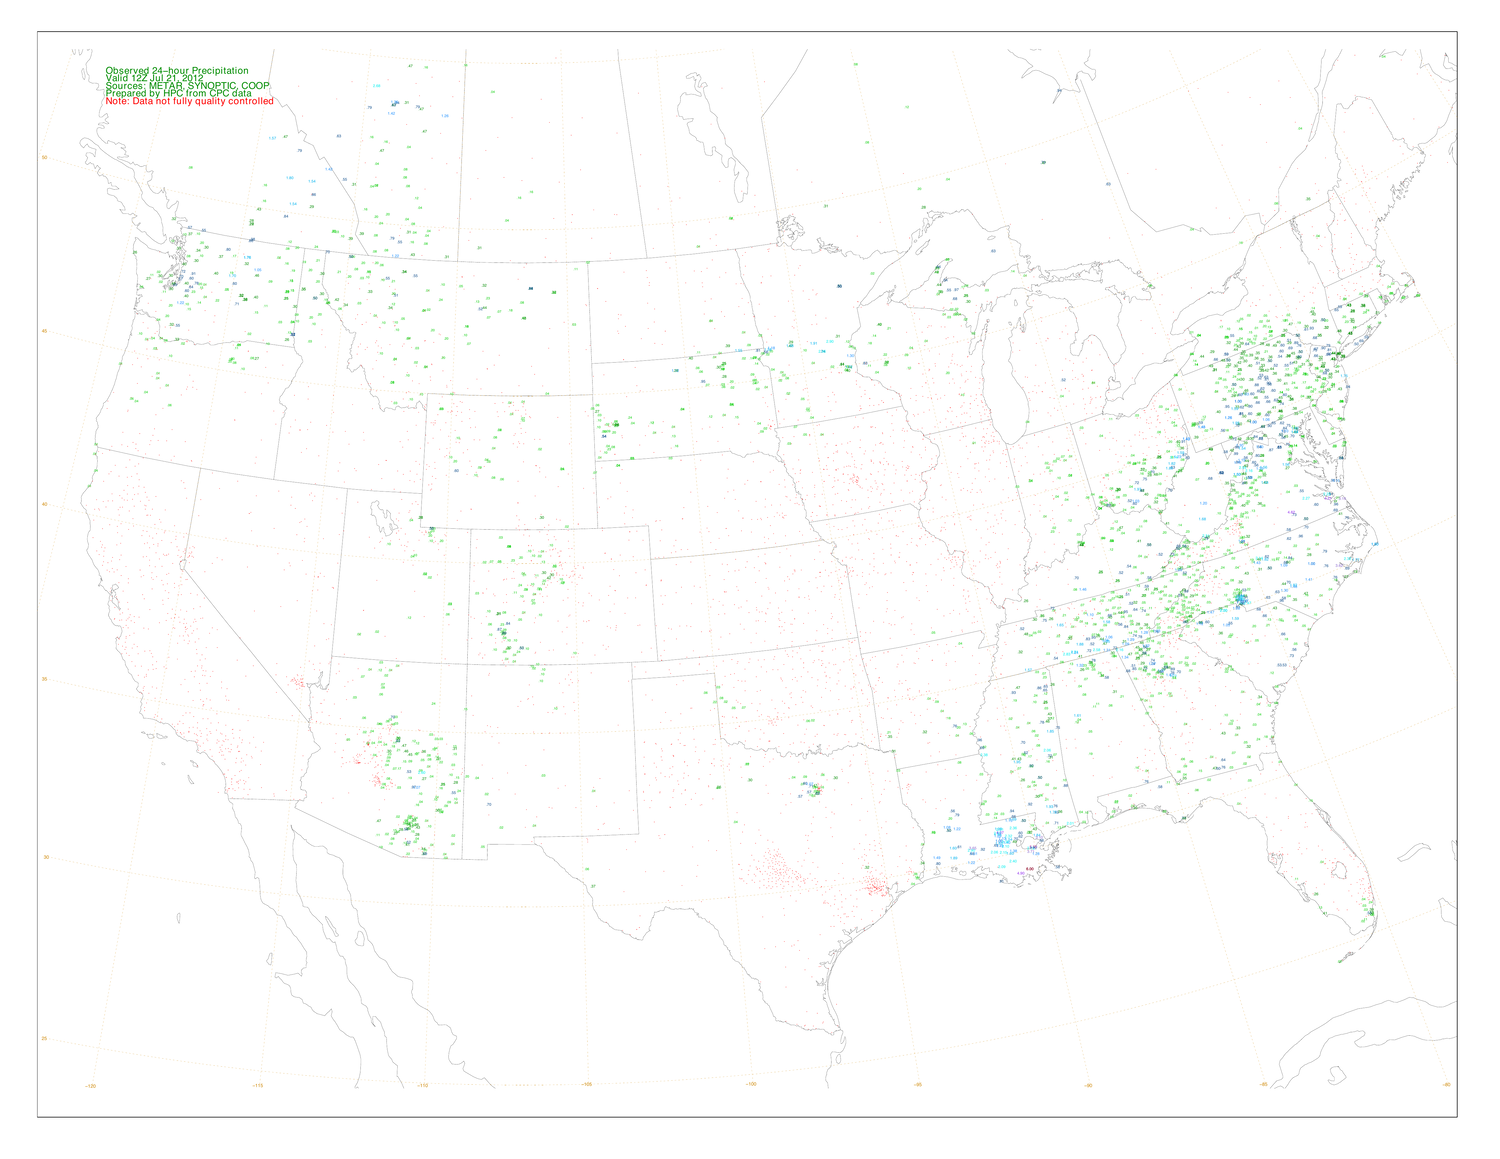
Source: U.S. National Weather Service, Hydrometeorological Prediction Center — Observed 24-Hour Precipitation map, 21 Jul 2012 (public domain)
Expected output
Observed 24-hour Precipitation
Valid 12Z Jul 21, 2012
Sources: METAR, SYNOPTIC, COOP
Prepared by HPC from CPC data
Note: Data not fully quality controlled

Map of the contiguous United States with state outlines and parts of neighbouring Canada and Mexico, overlaid with a dotted latitude–longitude grid labelled 50, 45, 40, 35, 30 and 25 along the left edge and -120, -115, -110, -105, -100, -95, -90, -85 and -80 along the bottom edge. Colour-coded numeric precipitation readings are plotted at point locations across the map; no station names are printed.
Observed 24-hour Precipitation
Valid 12Z Jul 21, 2012
Sources: METAR, SYNOPTIC, COOP
Prepared by HPC from CPC data
Note: Data not fully quality controlled
Map of the contiguous United States with state outlines and parts of neighbouring Canada and Mexico, overlaid with a dotted latitude–longitude grid labelled 50, 45, 40, 35, 30 and 25 along the left edge and -120, -115, -110, -105, -100, -95, -90, -85 and -80 along the bottom edge. Colour-coded numeric precipitation readings are plotted at point locations across the map; no station names are printed.a real map with a printed legend
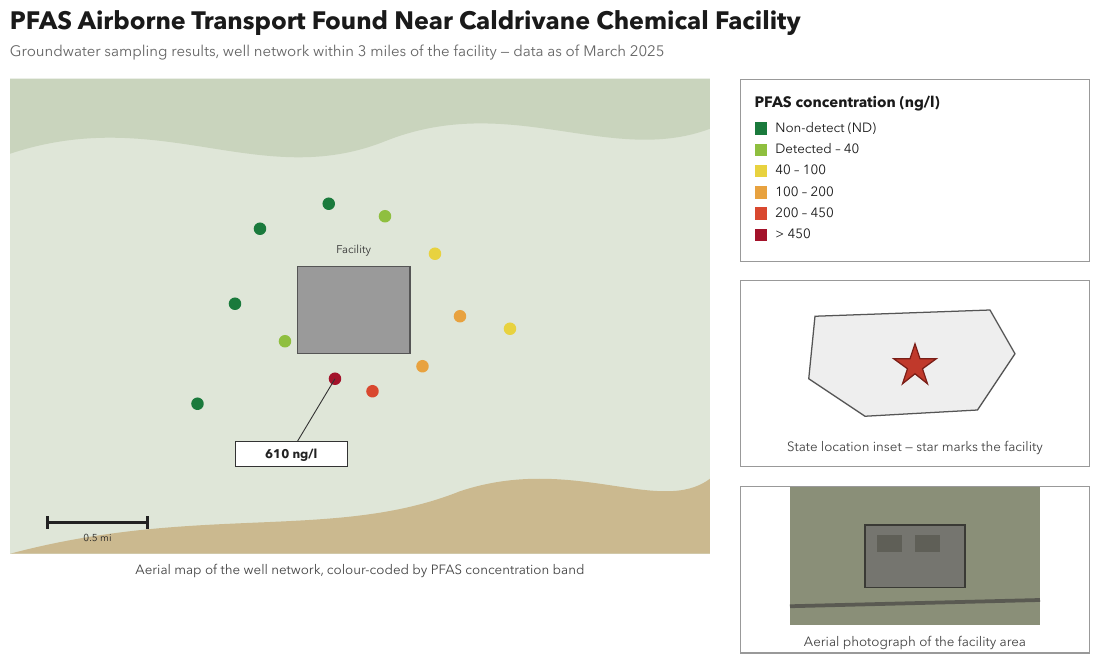
An aerial map of well locations, colour-coded by concentration band, with a six-entry legend, a
scale bar, a callout (610 ng/l), a state inset and a photograph. The positions are the content,
so the map is described as an image with every legend entry and label transcribed. Expected
boxes: the title, the subtitle, the map with its caption, the legend, the inset with its caption
and the photograph with its caption.
Source page
Expected output
PFAS Airborne Transport Found Near Caldrivane Chemical Facility
Groundwater sampling results, well network within 3 miles of the facility — data as of March 2025
Aerial map of a well network around a grey building labelled "Facility". Twelve wells are plotted as coloured dots around the building: four in the Non-detect (ND) colour, two Detected – 40, two 40 – 100, two 100 – 200, one 200 – 450 and one > 450. A callout from the > 450 well, just below the building, reads 610 ng/l. A scale bar in the lower left is labelled 0.5 mi.
Aerial map of the well network, colour-coded by PFAS concentration band
PFAS concentration (ng/l) Non-detect (ND) Detected – 40 40 – 100 100 – 200 200 – 450 > 450
A state outline with a star marking the facility.
State location inset — star marks the facility
An aerial photograph of the facility area: a building with two dark rectangles on its roof, and a road crossing below it.
Aerial photograph of the facility area
Neighbouring rules, and how they differ
More
Sample sources1 +
Public-domain U.S. federal government source material.
- U.S. National Weather Service, Hydrometeorological Prediction Center — Observed 24-Hour Precipitation map, 21 Jul 2012
Rule id diagrams-geographic-maps · images diagrams