Chart With a Printed Data Grid
A chart with its numbers printed beneath—annotate the chart or the grid?
✅ NormativeSettled. The requirement holds as written.📄 Page ruleCan be applied from the page alone.Read §9.1.2 in the RFC ↗
When a chart prints its data grid beside or beneath the canvas, the output MUST render that grid exactly as printed — same orientation, same headers, same row order — and MUST NOT render any other table for the chart.
When it applies
Some charts print their numbers as a small grid next to the canvas: a bar chart with bucket-columns
× metric-rows underneath, for example. That printed grid is often transposed relative to the
[Category, Value] shape a chart is usually reasoned about in.
Printed under the bar chart:            Transposed reconstruction — non-conforming:
| Metric   | $0–1k | $1k–5k | $5k+ |    | Bucket | Avg Premium |
| Avg Prem | 412   | 388    | 351  |    | $0–1k  | 412         |
                                        | $1k–5k | 388         |
Reading the examples. Each one pairs a source page with the output the rule expects. ✅ Sample: the rule applies. ❌ Counter-sample: it looks like it applies and does not, or a rendering got it wrong. A non-conforming output, in red, is shown only for contrast. … marks content left out of an excerpt.
Requirements
- The table representing the chart MUST open with
<table data-source="chart">, including when its values come from the printed grid. - The grid MUST be transcribed in its printed orientation. Metrics that run across the top stay across the top.
- The grid MUST NOT be transposed, and its rows and columns MUST NOT be reordered into a more natural shape.
- The output MUST NOT add a second, reconstructed version alongside it. One grid is printed; one grid is rendered.
- Values MUST NOT be re-keyed off the chart canvas — bars, points and axis ticks are not the source. Only what is printed as text in the grid counts.
A transposed version is non-conforming even when it reads better, in the same way that rewriting a cell's text is non-conforming.
Why as printed
This is the verbatim posture the whole protocol takes: transcribe what is on the page, do not improve it (see Cell Text Fidelity (§9.6.3), Accounting Number Formats (§9.6.1)). A second reconstructed copy also creates the duplication described in Duplicated Tables (§9.2.4) and Titles Banners Captions (§9.7.3) — two tables where the page printed one (never invent).
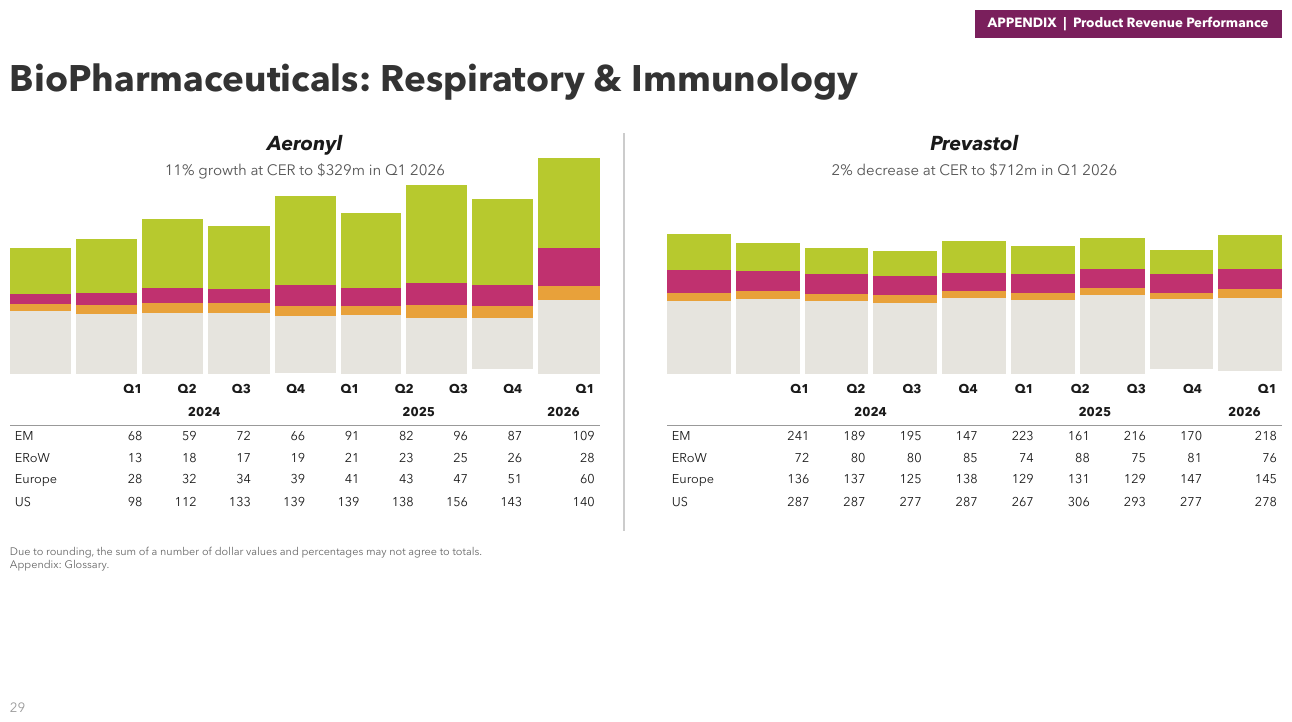
two charts with their grids beneath
Each chart prints a four-row grid under its bars — one row per series, one column per quarter, with the year as a spanning row between the quarters and the values. The grid is the rendering; the bars are not re-keyed.
Source page
Expected output · excerpt, the left chart
Aeronyl
11% growth at CER to $329m in Q1 2026
| Q1 | Q2 | Q3 | Q4 | Q1 | Q2 | Q3 | Q4 | Q1 | |
|---|---|---|---|---|---|---|---|---|---|
| 2024 | 2025 | 2026 | |||||||
| EM | 68 | 59 | 72 | 66 | 91 | 82 | 96 | 87 | 109 |
| ERoW | 13 | 18 | 17 | 19 | 21 | 23 | 25 | 26 | 28 |
| Europe | 28 | 32 | 34 | 39 | 41 | 43 | 47 | 51 | 60 |
| US | 98 | 112 | 133 | 139 | 139 | 138 | 156 | 143 | 140 |
Neighbouring rules, and how they differ
More
Rule id tables-chart-with-a-printed-data-grid · tables charts orientation