Row-Label Hierarchy
Indented row labels—how is the nesting carried?
✅ NormativeSettled. The requirement holds as written.📄 Page ruleCan be applied from the page alone.Read §9.5.5 in the RFC ↗
Where a table's row labels are indented to show nesting, every label cell MUST carry its
absolute level as a data-level attribute: <td data-level="2">iPhone</td>. Level 0 is the
leftmost label position in the stub column, 1 the next indent step, and so on — counted from the
left edge of the column, never from the row above.
When it applies
Financial statements and rate manuals encode hierarchy by indenting the row label. Flattened, "iPhone" and "Total net sales" read as siblings.
Printed stub:                     Rendered as:
Revenue                           <td data-level="0">Revenue</td>
  Products                        <td data-level="1">Products</td>
    iPhone          205,489       <td data-level="2">iPhone</td>
Total net sales     383,285       <th data-level="0">Total net sales</th>
A table whose indented labels all come out at the same level is the failure this rule exists to prevent.
Reading the examples. Each one pairs a source page with the output the rule expects. ✅ Sample: the rule applies. ❌ Counter-sample: it looks like it applies and does not, or a rendering got it wrong. A non-conforming output, in red, is shown only for contrast. … marks content left out of an excerpt.
Why flattening is dangerous
The flattened output is well-formed and looks correct. Nothing signals that a parent/child
relationship was dropped, so a reader summing the column double-counts: iPhone is inside
Total net sales, and the flattened table gives no way to know it. The damage is silent, which is
why the indentation MUST be preserved even where the choice of encoding seems secondary.
Structure lost3cc
25 for KVO shareholder where the page prints 2.5. The total row is bold across
all three cells.Source page
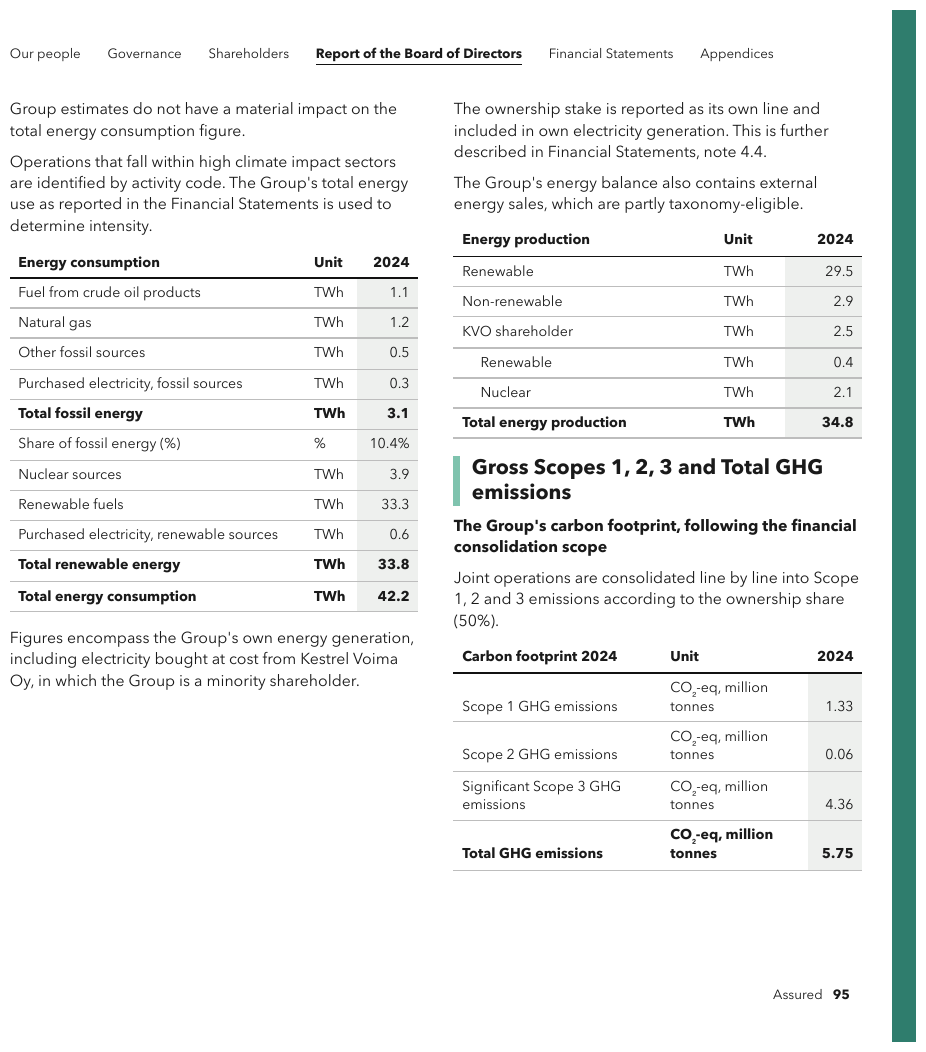
Expected output · table 2 of 3
| Energy production | Unit | 2024 |
|---|---|---|
| Renewable | TWh | 29.5 |
| Non-renewable | TWh | 2.9 |
| KVO shareholder | TWh | 2.5 |
| Renewable | TWh | 0.4 |
| Nuclear | TWh | 2.1 |
| Total energy production | TWh | 34.8 |
Non-conforming output
What the rule rules out.
| Energy production | Unit | 2024 | ||||||||||||||||||||||||||||||||||||||||||||||||||||||||||||||||||||||||||||||||||||||||||||||||
|---|---|---|---|---|---|---|---|---|---|---|---|---|---|---|---|---|---|---|---|---|---|---|---|---|---|---|---|---|---|---|---|---|---|---|---|---|---|---|---|---|---|---|---|---|---|---|---|---|---|---|---|---|---|---|---|---|---|---|---|---|---|---|---|---|---|---|---|---|---|---|---|---|---|---|---|---|---|---|---|---|---|---|---|---|---|---|---|---|---|---|---|---|---|---|---|---|---|---|
| … | ||||||||||||||||||||||||||||||||||||||||||||||||||||||||||||||||||||||||||||||||||||||||||||||||||
| Non-renewable | TWh | 2.9 | ||||||||||||||||||||||||||||||||||||||||||||||||||||||||||||||||||||||||||||||||||||||||||||||||
| KVO shareholder | TWh | 25 | ||||||||||||||||||||||||||||||||||||||||||||||||||||||||||||||||||||||||||||||||||||||||||||||||
| Renewable | TWh | 0.4 | ||||||||||||||||||||||||||||||||||||||||||||||||||||||||||||||||||||||||||||||||||||||||||||||||
| Nuclear | TWh | 2.1 | ||||||||||||||||||||||||||||||||||||||||||||||||||||||||||||||||||||||||||||||||||||||||||||||||
| Total energy production | TWh | 34.8 | ||||||||||||||||||||||||||||||||||||||||||||||||||||||||||||||||||||||||||||||||||||||||||||||||
Reading the level
- The level MUST be the number of indent steps between the left edge of the stub column and the
start of the label as printed. The leftmost label position is
0; each further indent step adds one. A level can therefore be checked against a single row without reading any other. - The label text MUST stay verbatim and the rows MUST stay in printed order.
- Where a table carries levels, every label cell in its stub that prints a label MUST carry one,
level-
0rows included. A table whose stub shows no nesting — no indentation, no "of which" rows — and has no labelled total carries none.
Absolute, not relative
A level is read off the print, never inherited from the row above:
- A row following a level-
2row is level3only if the page indents it further. At the same indent it is another level-2sibling. - A row MAY jump back several levels at once.
Total net salesreturning to0after aniPhoneat2is normal and needs no marker of its own.
Not from the numbers
A level MUST NOT be deepened because the arithmetic suggests a row is a component, and MUST NOT be flattened because the arithmetic does not add up. The indentation is the evidence; the values are not. A page whose sub-items do not sum to their parent is transcribed as printed.
Not as leading whitespace
The level MUST be carried as an attribute, not as leading spaces or : the first trim,
Markdown render or CSV round-trip removes whitespace and the structure goes with it. Where an output
format cannot carry a cell attribute, the level SHOULD go into a dedicated level column rather than
into whitespace.
Recognising a child row
A child is indented relative to the row above it, and its value is a component of a figure elsewhere in the column rather than an independent record. Phrases such as "out of which", "of which" and "within which" state the same relationship in words; a row introduced by one MUST be rendered as a child even where its indentation is slight. The same page may present a breakdown as an indented stub or as a row that decomposes into sub-rows; both are the same phenomenon and are rendered the same way.
A total row takes a level like any other row, usually 0; how its label cell is marked is defined
in Total and Subtotal Rows (§9.5.6).
"- Out of which amount written off" is indented under "Amount involved in frauds"table-with-breakdown
it is a
component of that figure, not a peer, so it is level 1. The header labels wrap only for width.
Source page
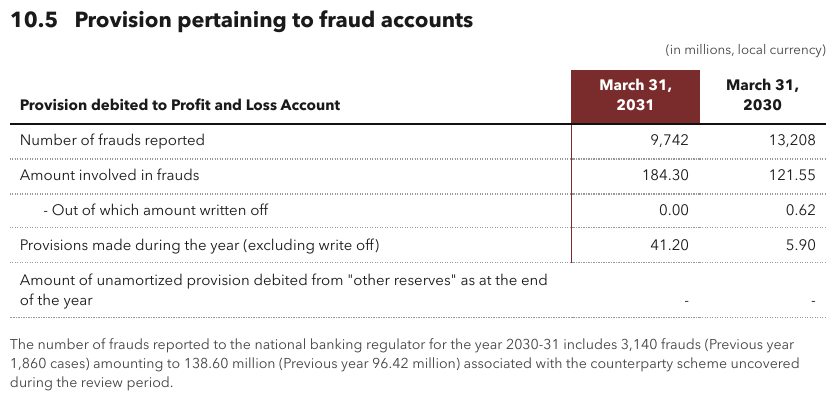
Expected output
| Provision debited to Profit and Loss Account | March 31, 2031 | March 31, 2030 |
|---|---|---|
| Number of frauds reported | 9,742 | 13,208 |
| Amount involved in frauds | 184.30 | 121.55 |
| - Out of which amount written off | 0.00 | 0.62 |
| Provisions made during the year (excluding write off) | 41.20 | 5.90 |
| Amount of unamortized provision debited from "other reserves" as at the end of the year | - | - |
Rule numbers nest into numbered and lettered sub-items702
0 to 3; the rule-number column is
not part of the label hierarchy. Labels that wrap at the column edge are joined.Source page
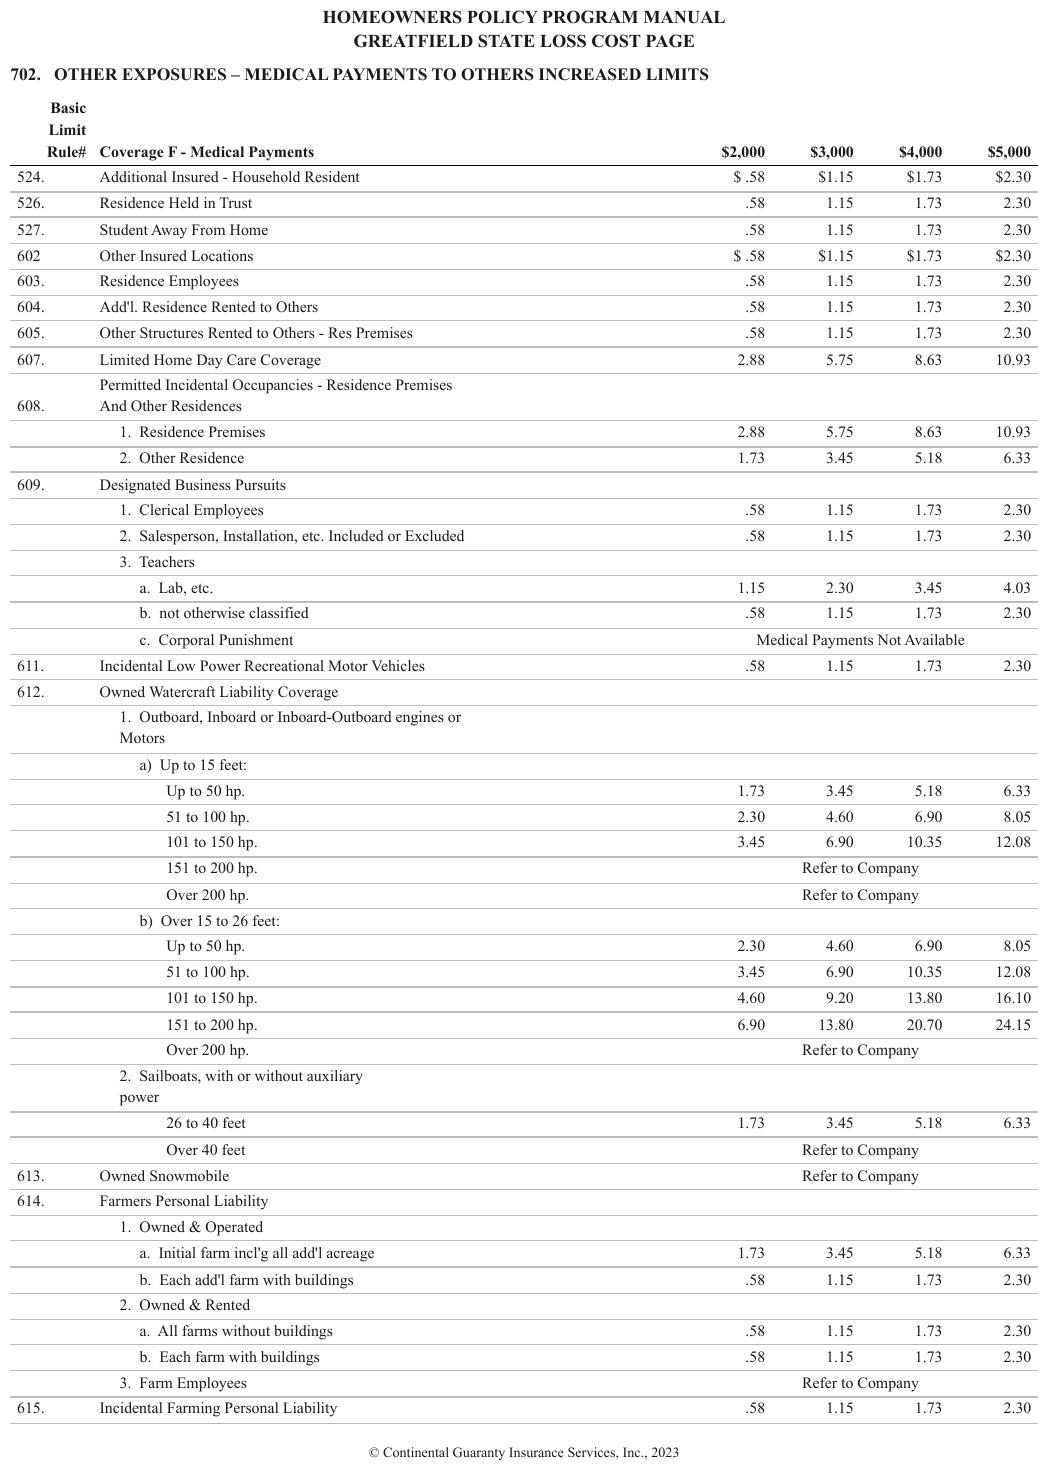
Expected output · excerpt
| Basic Limit Rule# | Coverage F - Medical Payments | $2,000 | $3,000 | $4,000 | $5,000 | |||||||||||||||||||||||||||||||||||||||||||||||||||||||||||||||||||||||||||||||||||||||||||||
|---|---|---|---|---|---|---|---|---|---|---|---|---|---|---|---|---|---|---|---|---|---|---|---|---|---|---|---|---|---|---|---|---|---|---|---|---|---|---|---|---|---|---|---|---|---|---|---|---|---|---|---|---|---|---|---|---|---|---|---|---|---|---|---|---|---|---|---|---|---|---|---|---|---|---|---|---|---|---|---|---|---|---|---|---|---|---|---|---|---|---|---|---|---|---|---|---|---|---|
| 524. | Additional Insured - Household Resident | $ .58 | $1.15 | $1.73 | $2.30 | |||||||||||||||||||||||||||||||||||||||||||||||||||||||||||||||||||||||||||||||||||||||||||||
| … | ||||||||||||||||||||||||||||||||||||||||||||||||||||||||||||||||||||||||||||||||||||||||||||||||||
| 607. | Limited Home Day Care Coverage | 2.88 | 5.75 | 8.63 | 10.93 | |||||||||||||||||||||||||||||||||||||||||||||||||||||||||||||||||||||||||||||||||||||||||||||
| 608. | Permitted Incidental Occupancies - Residence Premises And Other Residences | |||||||||||||||||||||||||||||||||||||||||||||||||||||||||||||||||||||||||||||||||||||||||||||||||
| 1. Residence Premises | 2.88 | 5.75 | 8.63 | 10.93 | ||||||||||||||||||||||||||||||||||||||||||||||||||||||||||||||||||||||||||||||||||||||||||||||
| 2. Other Residence | 1.73 | 3.45 | 5.18 | 6.33 | ||||||||||||||||||||||||||||||||||||||||||||||||||||||||||||||||||||||||||||||||||||||||||||||
| 609. | Designated Business Pursuits | |||||||||||||||||||||||||||||||||||||||||||||||||||||||||||||||||||||||||||||||||||||||||||||||||
| 1. Clerical Employees | .58 | 1.15 | 1.73 | 2.30 | ||||||||||||||||||||||||||||||||||||||||||||||||||||||||||||||||||||||||||||||||||||||||||||||
| 2. Salesperson, Installation, etc. Included or Excluded | .58 | 1.15 | 1.73 | 2.30 | ||||||||||||||||||||||||||||||||||||||||||||||||||||||||||||||||||||||||||||||||||||||||||||||
| 3. Teachers | ||||||||||||||||||||||||||||||||||||||||||||||||||||||||||||||||||||||||||||||||||||||||||||||||||
| a. Lab, etc. | 1.15 | 2.30 | 3.45 | 4.03 | ||||||||||||||||||||||||||||||||||||||||||||||||||||||||||||||||||||||||||||||||||||||||||||||
| b. not otherwise classified | .58 | 1.15 | 1.73 | 2.30 | ||||||||||||||||||||||||||||||||||||||||||||||||||||||||||||||||||||||||||||||||||||||||||||||
| c. Corporal Punishment | Medical Payments Not Available | |||||||||||||||||||||||||||||||||||||||||||||||||||||||||||||||||||||||||||||||||||||||||||||||||
| 611. | Incidental Low Power Recreational Motor Vehicles | .58 | 1.15 | 1.73 | 2.30 | |||||||||||||||||||||||||||||||||||||||||||||||||||||||||||||||||||||||||||||||||||||||||||||
| 612. | Owned Watercraft Liability Coverage | |||||||||||||||||||||||||||||||||||||||||||||||||||||||||||||||||||||||||||||||||||||||||||||||||
| 1. Outboard, Inboard or Inboard-Outboard engines or Motors | ||||||||||||||||||||||||||||||||||||||||||||||||||||||||||||||||||||||||||||||||||||||||||||||||||
| a) Up to 15 feet: | ||||||||||||||||||||||||||||||||||||||||||||||||||||||||||||||||||||||||||||||||||||||||||||||||||
| Up to 50 hp. | 1.73 | 3.45 | 5.18 | 6.33 | ||||||||||||||||||||||||||||||||||||||||||||||||||||||||||||||||||||||||||||||||||||||||||||||
| … | ||||||||||||||||||||||||||||||||||||||||||||||||||||||||||||||||||||||||||||||||||||||||||||||||||
Numbered parents (1)–(10) with indented lettered childrenyellow
Numbered parents (1)–(10) with indented lettered children — (A) Short / (B) Intermediate /
(C) Long, (A) Dividends / (B) Capital gains — and an indented, unlettered dividends under
(5) Preferred stock. The yellow fill marks input cells and carries no value, so it is not
rendered.
Source page
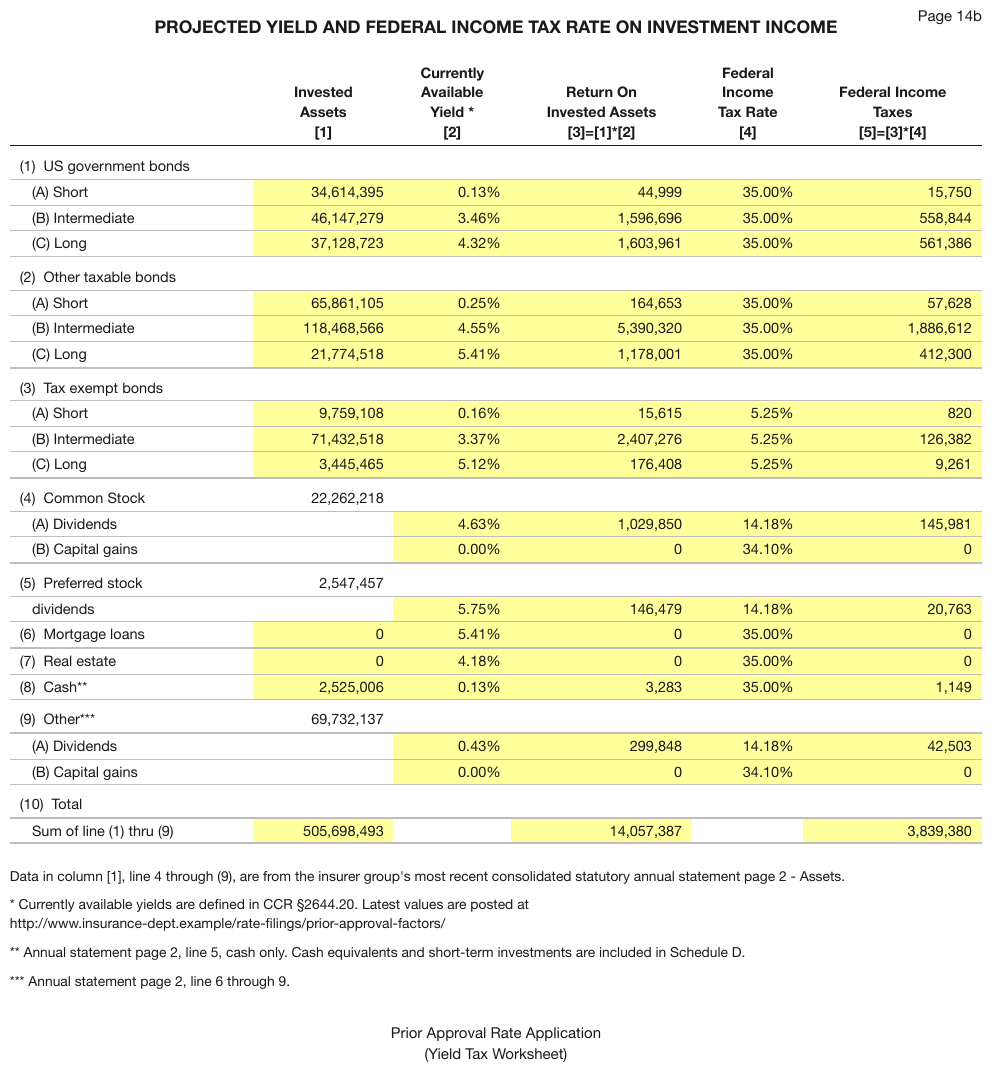
Expected output · excerpt
| Invested Assets [1] | Currently Available Yield * [2] | Return On Invested Assets [3]=[1]*[2] | Federal Income Tax Rate [4] | Federal Income Taxes [5]=[3]*[4] | ||||||||||||||||||||||||||||||||||||||||||||||||||||||||||||||||||||||||||||||||||||||||||||||
|---|---|---|---|---|---|---|---|---|---|---|---|---|---|---|---|---|---|---|---|---|---|---|---|---|---|---|---|---|---|---|---|---|---|---|---|---|---|---|---|---|---|---|---|---|---|---|---|---|---|---|---|---|---|---|---|---|---|---|---|---|---|---|---|---|---|---|---|---|---|---|---|---|---|---|---|---|---|---|---|---|---|---|---|---|---|---|---|---|---|---|---|---|---|---|---|---|---|---|
| (1) US government bonds | ||||||||||||||||||||||||||||||||||||||||||||||||||||||||||||||||||||||||||||||||||||||||||||||||||
| (A) Short | 34,614,395 | 0.13% | 44,999 | 35.00% | 15,750 | |||||||||||||||||||||||||||||||||||||||||||||||||||||||||||||||||||||||||||||||||||||||||||||
| (B) Intermediate | 46,147,279 | 3.46% | 1,596,696 | 35.00% | 558,844 | |||||||||||||||||||||||||||||||||||||||||||||||||||||||||||||||||||||||||||||||||||||||||||||
| (C) Long | 37,128,723 | 4.32% | 1,603,961 | 35.00% | 561,386 | |||||||||||||||||||||||||||||||||||||||||||||||||||||||||||||||||||||||||||||||||||||||||||||
| (2) Other taxable bonds | ||||||||||||||||||||||||||||||||||||||||||||||||||||||||||||||||||||||||||||||||||||||||||||||||||
| (A) Short | 65,861,105 | 0.25% | 164,653 | 35.00% | 57,628 | |||||||||||||||||||||||||||||||||||||||||||||||||||||||||||||||||||||||||||||||||||||||||||||
| … | ||||||||||||||||||||||||||||||||||||||||||||||||||||||||||||||||||||||||||||||||||||||||||||||||||
| (4) Common Stock | 22,262,218 | |||||||||||||||||||||||||||||||||||||||||||||||||||||||||||||||||||||||||||||||||||||||||||||||||
| (A) Dividends | 4.63% | 1,029,850 | 14.18% | 145,981 | ||||||||||||||||||||||||||||||||||||||||||||||||||||||||||||||||||||||||||||||||||||||||||||||
| (B) Capital gains | 0.00% | 0 | 34.10% | 0 | ||||||||||||||||||||||||||||||||||||||||||||||||||||||||||||||||||||||||||||||||||||||||||||||
| (5) Preferred stock | 2,547,457 | |||||||||||||||||||||||||||||||||||||||||||||||||||||||||||||||||||||||||||||||||||||||||||||||||
| dividends | 5.75% | 146,479 | 14.18% | 20,763 | ||||||||||||||||||||||||||||||||||||||||||||||||||||||||||||||||||||||||||||||||||||||||||||||
| … | ||||||||||||||||||||||||||||||||||||||||||||||||||||||||||||||||||||||||||||||||||||||||||||||||||
Ticket and Transactions are indented under the Same Shop Sales parent rowssssa
The parent rows
are bold in every cell, values included; the stub header Fiscal year ending December, is italic
and not bold. Most percentages print a space before %, a few do not — kept as printed.
Source page
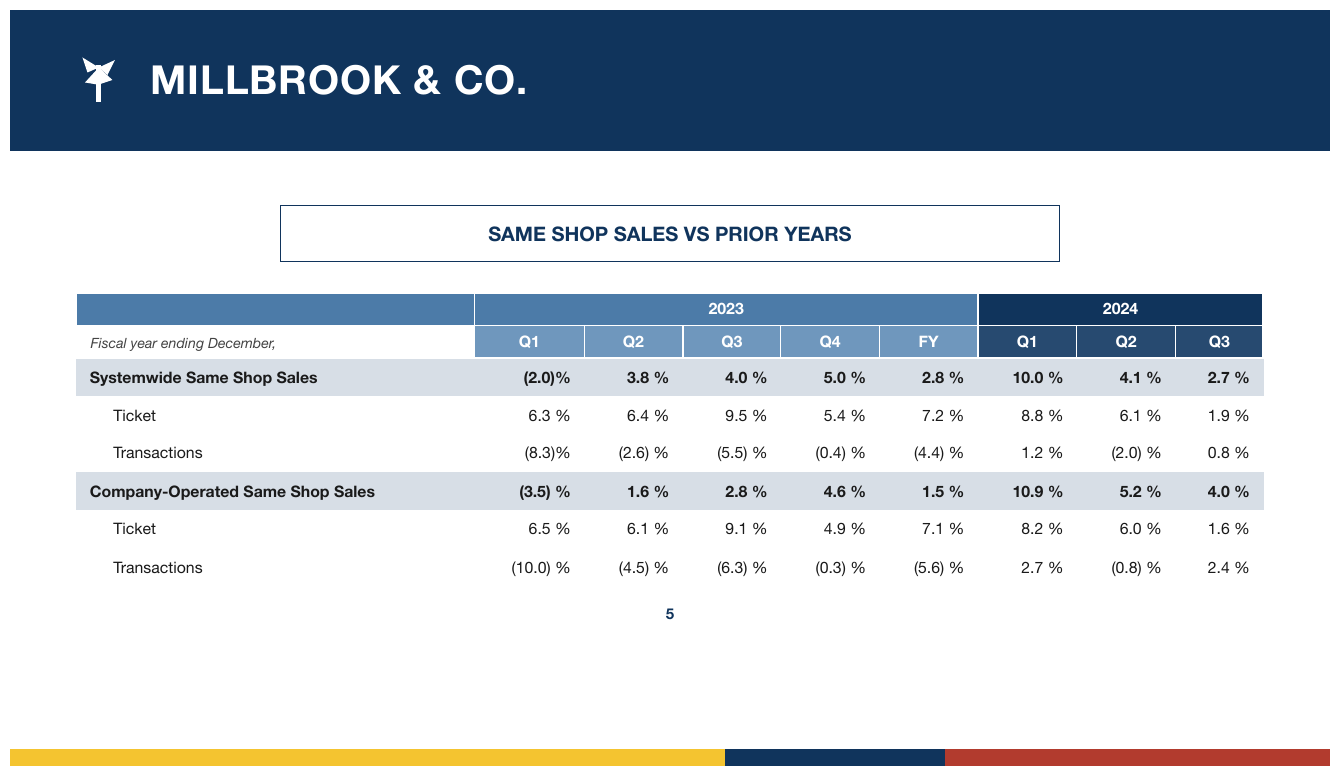
Expected output
| 2023 | 2024 | |||||||
|---|---|---|---|---|---|---|---|---|
| Fiscal year ending December, | Q1 | Q2 | Q3 | Q4 | FY | Q1 | Q2 | Q3 |
| Systemwide Same Shop Sales | (2.0)% | 3.8 % | 4.0 % | 5.0 % | 2.8 % | 10.0 % | 4.1 % | 2.7 % |
| Ticket | 6.3 % | 6.4 % | 9.5 % | 5.4 % | 7.2 % | 8.8 % | 6.1 % | 1.9 % |
| Transactions | (8.3)% | (2.6) % | (5.5) % | (0.4) % | (4.4) % | 1.2 % | (2.0) % | 0.8 % |
| Company-Operated Same Shop Sales | (3.5) % | 1.6 % | 2.8 % | 4.6 % | 1.5 % | 10.9 % | 5.2 % | 4.0 % |
| Ticket | 6.5 % | 6.1 % | 9.1 % | 4.9 % | 7.1 % | 8.2 % | 6.0 % | 1.6 % |
| Transactions | (10.0) % | (4.5) % | (6.3) % | (0.3) % | (5.6) % | 2.7 % | (0.8) % | 2.4 % |
Bold TAMI / Professional Services parents over italic children (TAMI, Technology, …)dt1
The
page prints no indentation: every label starts at the same left edge, so every row is level
0. The parent/child distinction is carried only by weight and slant, which apply to every cell of
those rows and are rendered per cell. The table closes with a TOTAL row, so its stub carries
levels.
Source page
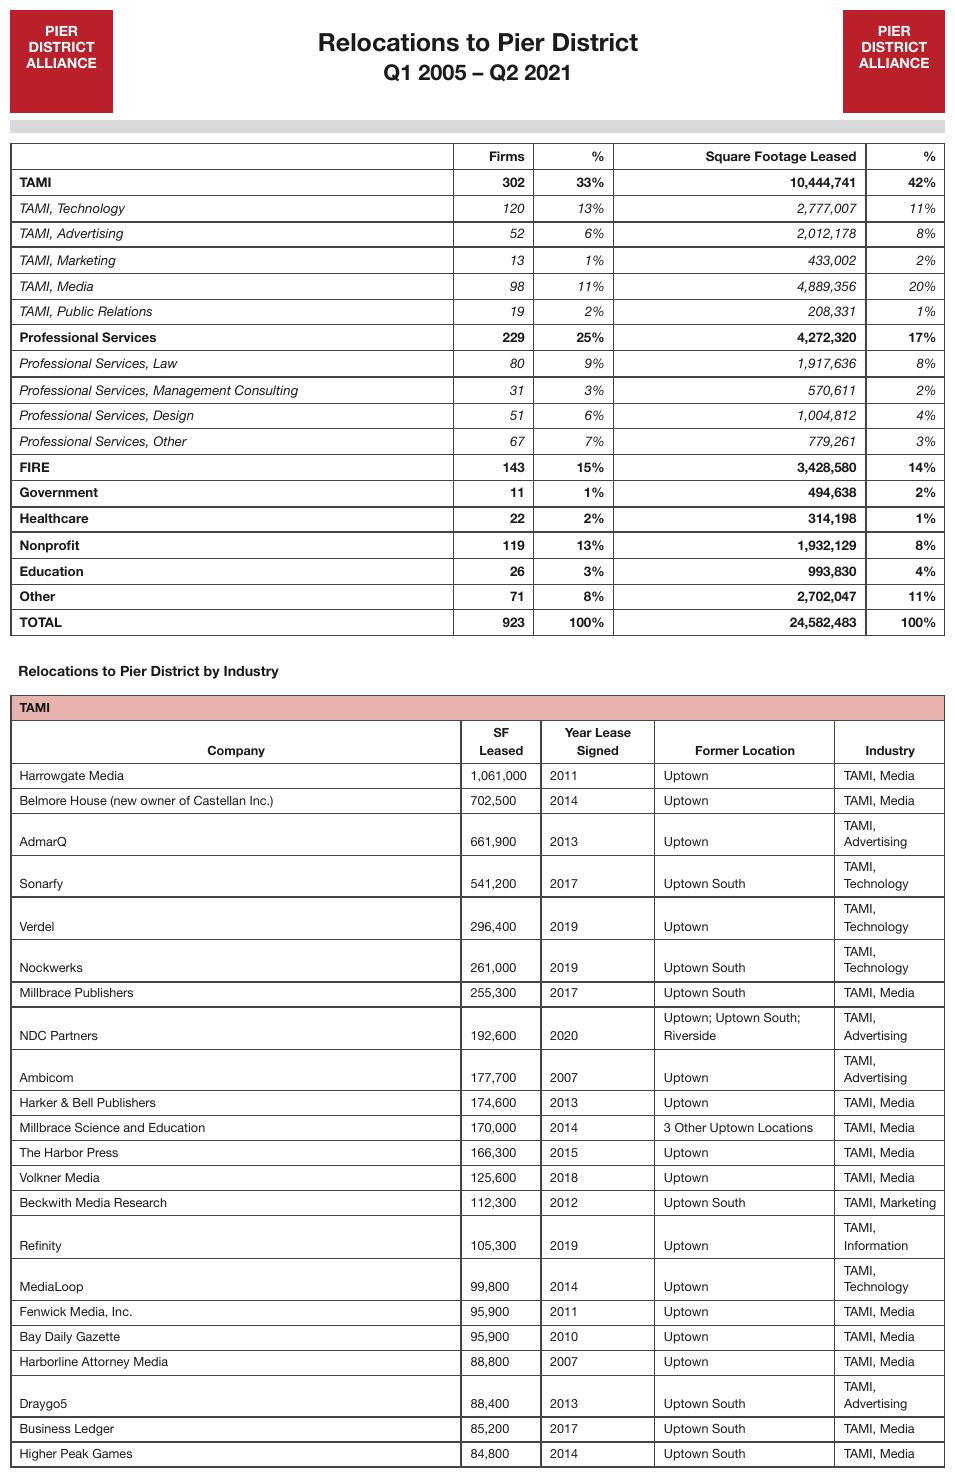
Expected output · table 1 of 2, excerpt
| Firms | % | Square Footage Leased | % | |||||||||||||||||||||||||||||||||||||||||||||||||||||||||||||||||||||||||||||||||||||||||||||||
|---|---|---|---|---|---|---|---|---|---|---|---|---|---|---|---|---|---|---|---|---|---|---|---|---|---|---|---|---|---|---|---|---|---|---|---|---|---|---|---|---|---|---|---|---|---|---|---|---|---|---|---|---|---|---|---|---|---|---|---|---|---|---|---|---|---|---|---|---|---|---|---|---|---|---|---|---|---|---|---|---|---|---|---|---|---|---|---|---|---|---|---|---|---|---|---|---|---|---|
| TAMI | 302 | 33% | 10,444,741 | 42% | ||||||||||||||||||||||||||||||||||||||||||||||||||||||||||||||||||||||||||||||||||||||||||||||
| TAMI, Technology | 120 | 13% | 2,777,007 | 11% | ||||||||||||||||||||||||||||||||||||||||||||||||||||||||||||||||||||||||||||||||||||||||||||||
| TAMI, Advertising | 52 | 6% | 2,012,178 | 8% | ||||||||||||||||||||||||||||||||||||||||||||||||||||||||||||||||||||||||||||||||||||||||||||||
| TAMI, Marketing | 13 | 1% | 433,002 | 2% | ||||||||||||||||||||||||||||||||||||||||||||||||||||||||||||||||||||||||||||||||||||||||||||||
| TAMI, Media | 98 | 11% | 4,889,356 | 20% | ||||||||||||||||||||||||||||||||||||||||||||||||||||||||||||||||||||||||||||||||||||||||||||||
| TAMI, Public Relations | 19 | 2% | 208,331 | 1% | ||||||||||||||||||||||||||||||||||||||||||||||||||||||||||||||||||||||||||||||||||||||||||||||
| … | ||||||||||||||||||||||||||||||||||||||||||||||||||||||||||||||||||||||||||||||||||||||||||||||||||
細分 breakdown:批發 Wholesale and 其中 within which:航空運輸 Air transport open breakdowns of…P200509160137_0137_6519
The page prints no indentation; the relationship is stated in
words, so each breakdown row is level 1, and the plain-weight rows that continue the same
breakdown (零售 Retail, 陸上運輸 Land transport, 海運 Maritime transport) are level 1 with it.
Source page
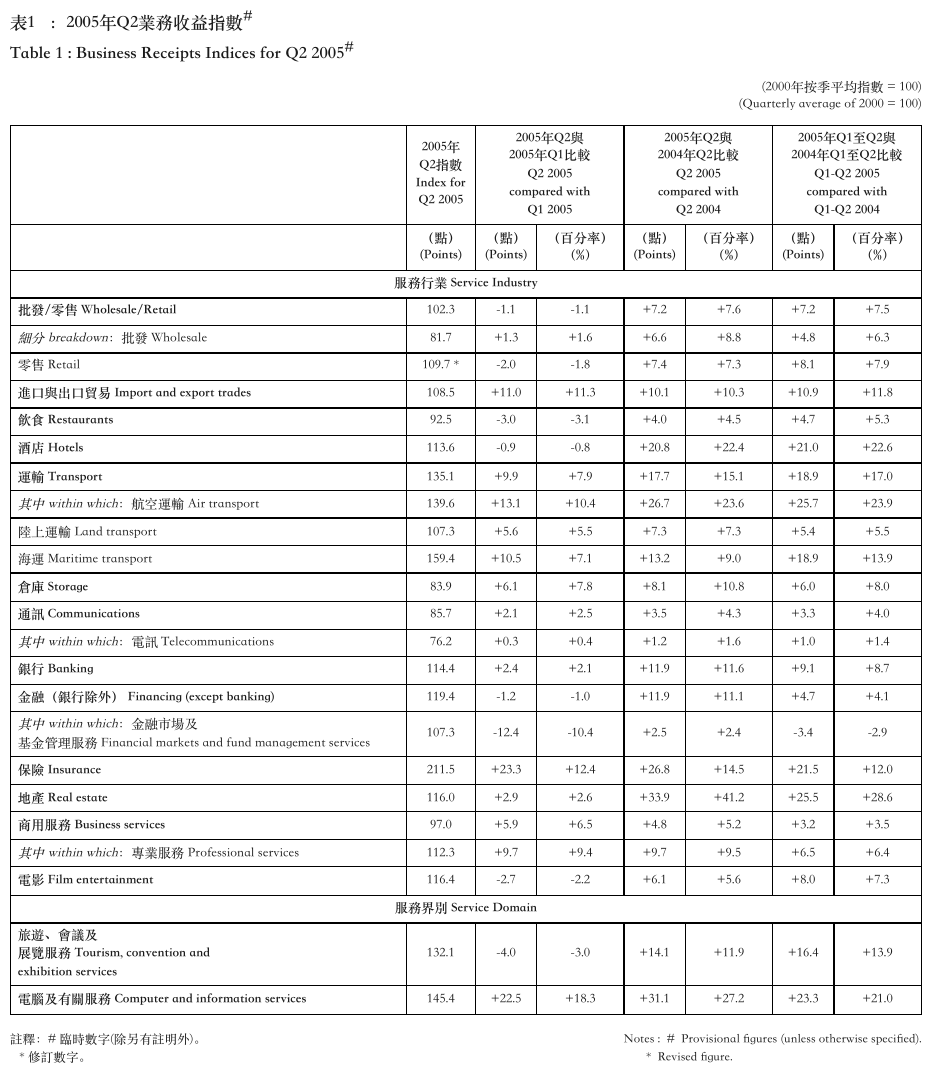
Expected output · excerpt
| 2005年 Q2指數 Index for Q2 2005 | 2005年Q2與 2005年Q1比較 Q2 2005 compared with Q1 2005 | 2005年Q2與 2004年Q2比較 Q2 2005 compared with Q2 2004 | 2005年Q1至Q2與 2004年Q1至Q2比較 Q1-Q2 2005 compared with Q1-Q2 2004 | |||||||||||||||||||||||||||||||||||||||||||||||||||||||||||||||||||||||||||||||||||||||||||||||
|---|---|---|---|---|---|---|---|---|---|---|---|---|---|---|---|---|---|---|---|---|---|---|---|---|---|---|---|---|---|---|---|---|---|---|---|---|---|---|---|---|---|---|---|---|---|---|---|---|---|---|---|---|---|---|---|---|---|---|---|---|---|---|---|---|---|---|---|---|---|---|---|---|---|---|---|---|---|---|---|---|---|---|---|---|---|---|---|---|---|---|---|---|---|---|---|---|---|---|
| (點) (Points) | (點) (Points) | (百分率) (%) | (點) (Points) | (百分率) (%) | (點) (Points) | (百分率) (%) | ||||||||||||||||||||||||||||||||||||||||||||||||||||||||||||||||||||||||||||||||||||||||||||
| 服務行業 Service Industry | ||||||||||||||||||||||||||||||||||||||||||||||||||||||||||||||||||||||||||||||||||||||||||||||||||
| 批發/零售 Wholesale/Retail | 102.3 | -1.1 | -1.1 | +7.2 | +7.6 | +7.2 | +7.5 | |||||||||||||||||||||||||||||||||||||||||||||||||||||||||||||||||||||||||||||||||||||||||||
| 細分 breakdown:批發 Wholesale | 81.7 | +1.3 | +1.6 | +6.6 | +8.8 | +4.8 | +6.3 | |||||||||||||||||||||||||||||||||||||||||||||||||||||||||||||||||||||||||||||||||||||||||||
| 零售 Retail | 109.7 * | -2.0 | -1.8 | +7.4 | +7.3 | +8.1 | +7.9 | |||||||||||||||||||||||||||||||||||||||||||||||||||||||||||||||||||||||||||||||||||||||||||
| 進口與出口貿易 Import and export trades | 108.5 | +11.0 | +11.3 | +10.1 | +10.3 | +10.9 | +11.8 | |||||||||||||||||||||||||||||||||||||||||||||||||||||||||||||||||||||||||||||||||||||||||||
| 飲食 Restaurants | 92.5 | -3.0 | -3.1 | +4.0 | +4.5 | +4.7 | +5.3 | |||||||||||||||||||||||||||||||||||||||||||||||||||||||||||||||||||||||||||||||||||||||||||
| 酒店 Hotels | 113.6 | -0.9 | -0.8 | +20.8 | +22.4 | +21.0 | +22.6 | |||||||||||||||||||||||||||||||||||||||||||||||||||||||||||||||||||||||||||||||||||||||||||
| 運輸 Transport | 135.1 | +9.9 | +7.9 | +17.7 | +15.1 | +18.9 | +17.0 | |||||||||||||||||||||||||||||||||||||||||||||||||||||||||||||||||||||||||||||||||||||||||||
| 其中 within which:航空運輸 Air transport | 139.6 | +13.1 | +10.4 | +26.7 | +23.6 | +25.7 | +23.9 | |||||||||||||||||||||||||||||||||||||||||||||||||||||||||||||||||||||||||||||||||||||||||||
| 陸上運輸 Land transport | 107.3 | +5.6 | +5.5 | +7.3 | +7.3 | +5.4 | +5.5 | |||||||||||||||||||||||||||||||||||||||||||||||||||||||||||||||||||||||||||||||||||||||||||
| 海運 Maritime transport | 159.4 | +10.5 | +7.1 | +13.2 | +9.0 | +18.9 | +13.9 | |||||||||||||||||||||||||||||||||||||||||||||||||||||||||||||||||||||||||||||||||||||||||||
| … | ||||||||||||||||||||||||||||||||||||||||||||||||||||||||||||||||||||||||||||||||||||||||||||||||||
Two more stub shapes
Two-column stubs
Where a table sets sub-labels in a second stub column to the right of the parent label, one per
line, each with its own values, the output MUST render a two-column stub: the parent label in the
first column, spanning its children with a rowspan where the page prints it as one cell, and each
sub-label in the second column on its own row.
a stub split into two columns
Unallocated interest charges sits in the first stub column, one ruled cell tall enough for both
sub-labels, with – external and – intra-group in a second column to its right, each with its own
values; the 6 months 2024 cell of – external is empty. Every group on the page closes with an
unlabelled bold total. No label is indented, so every label — in either stub column — is level
0; the closing grand total is a labelled total, so its label cell is a <th>.
Source page
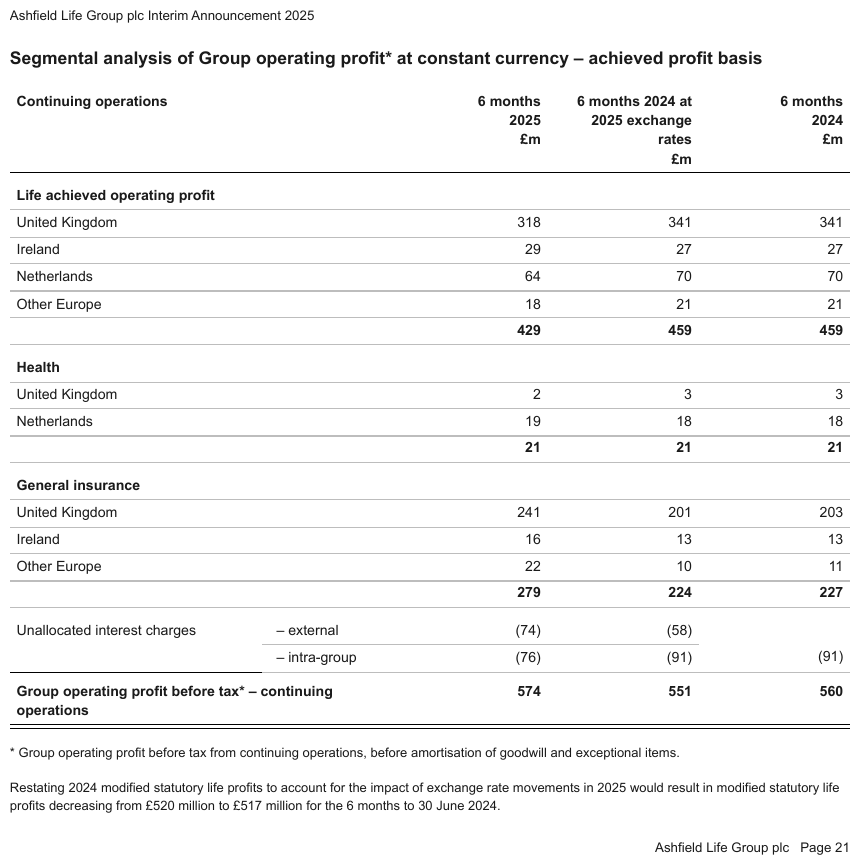
Expected output · excerpt
| Continuing operations | 6 months 2025 £m | 6 months 2024 at 2025 exchange rates £m | 6 months 2024 £m | |||||||||||||||||||||||||||||||||||||||||||||||||||||||||||||||||||||||||||||||||||||||||||||||
|---|---|---|---|---|---|---|---|---|---|---|---|---|---|---|---|---|---|---|---|---|---|---|---|---|---|---|---|---|---|---|---|---|---|---|---|---|---|---|---|---|---|---|---|---|---|---|---|---|---|---|---|---|---|---|---|---|---|---|---|---|---|---|---|---|---|---|---|---|---|---|---|---|---|---|---|---|---|---|---|---|---|---|---|---|---|---|---|---|---|---|---|---|---|---|---|---|---|---|
| Life achieved operating profit | ||||||||||||||||||||||||||||||||||||||||||||||||||||||||||||||||||||||||||||||||||||||||||||||||||
| United Kingdom | 318 | 341 | 341 | |||||||||||||||||||||||||||||||||||||||||||||||||||||||||||||||||||||||||||||||||||||||||||||||
| … | ||||||||||||||||||||||||||||||||||||||||||||||||||||||||||||||||||||||||||||||||||||||||||||||||||
| Other Europe | 22 | 10 | 11 | |||||||||||||||||||||||||||||||||||||||||||||||||||||||||||||||||||||||||||||||||||||||||||||||
| 279 | 224 | 227 | ||||||||||||||||||||||||||||||||||||||||||||||||||||||||||||||||||||||||||||||||||||||||||||||||
| Unallocated interest charges | – external | (74) | (58) | |||||||||||||||||||||||||||||||||||||||||||||||||||||||||||||||||||||||||||||||||||||||||||||||
| – intra-group | (76) | (91) | (91) | |||||||||||||||||||||||||||||||||||||||||||||||||||||||||||||||||||||||||||||||||||||||||||||||
| Group operating profit before tax* – continuing operations | 574 | 551 | 560 | |||||||||||||||||||||||||||||||||||||||||||||||||||||||||||||||||||||||||||||||||||||||||||||||
values staggered inside one column
A Japanese profit-and-loss statement with one 金額 (amount) column: parent amounts right-aligned
at the column edge, children set further left, and (うち…) ("of which") sub-items further left
still. One value column. The stagger is styling; the hierarchy is carried only by the stub's
data-level: the bold categories are 0, their items 1, and the (うち…) rows, introduced by
"of which", 2.
Source page
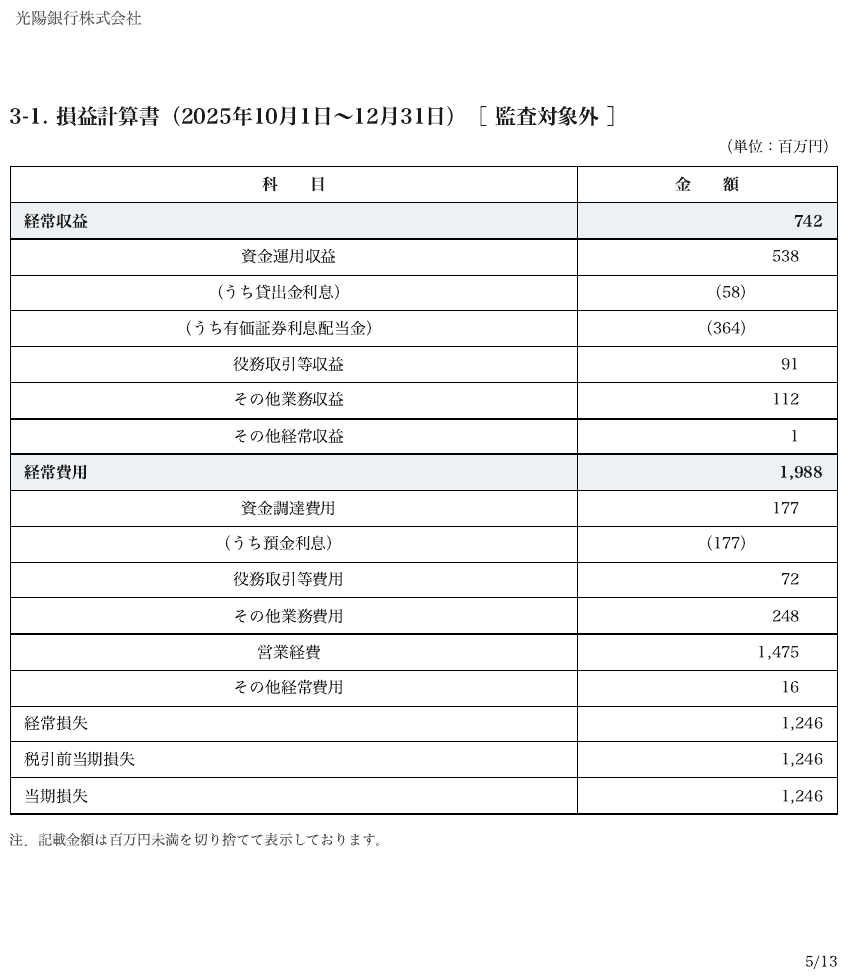
Expected output
| 科 目 | 金 額 |
|---|---|
| 経常収益 | 742 |
| 資金運用収益 | 538 |
| (うち貸出金利息) | (58) |
| (うち有価証券利息配当金) | (364) |
| 役務取引等収益 | 91 |
| その他業務収益 | 112 |
| その他経常収益 | 1 |
| 経常費用 | 1,988 |
| 資金調達費用 | 177 |
| (うち預金利息) | (177) |
| 役務取引等費用 | 72 |
| その他業務費用 | 248 |
| 営業経費 | 1,475 |
| その他経常費用 | 16 |
| 経常損失 | 1,246 |
| 税引前当期損失 | 1,246 |
| 当期損失 | 1,246 |
a two-column stub, ruled
Statutory turnover and Proportionate EBITDA sit in the first stub column; – NorthStar Wireless and – Other Americas in a second column beside each, one per line, each with values; an
unlabelled bold subtotal closes each pair. Here the rules run across the first column between the
two lines, so Proportionate EBITDA and (before exceptional items) are two cells, not one
spanning cell.
Source page
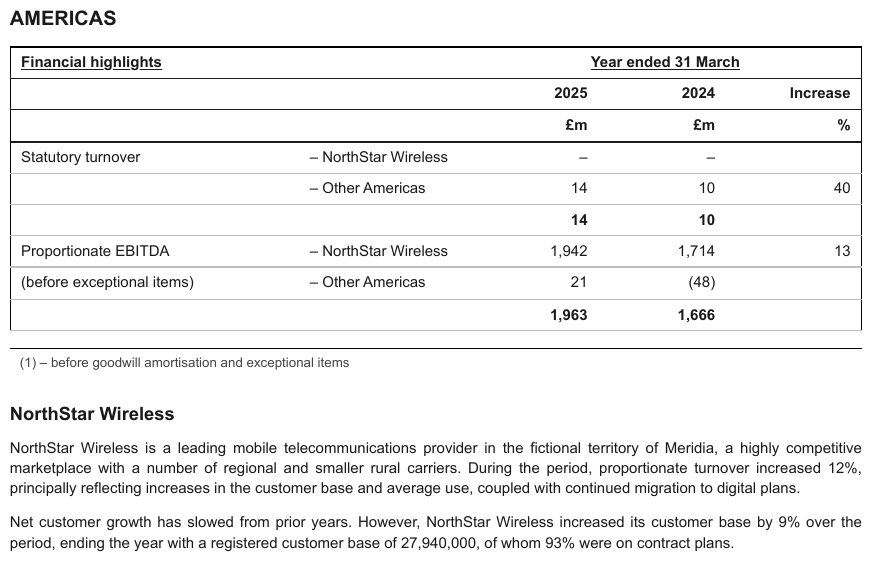
Expected output
| Financial highlights | Year ended 31 March | |||
|---|---|---|---|---|
| 2025 | 2024 | Increase | ||
| £m | £m | % | ||
| Statutory turnover | – NorthStar Wireless | – | – | |
| – Other Americas | 14 | 10 | 40 | |
| 14 | 10 | |||
| Proportionate EBITDA | – NorthStar Wireless | 1,942 | 1,714 | 13 |
| (before exceptional items) | – Other Americas | 21 | (48) | |
| 1,963 | 1,666 | |||
Neighbouring rules, and how they differ
More
Rule id tables-row-label-hierarchy · tables rule hierarchy encoding