Line Charts
A line with no callouts—what is recorded at each tick?
✅ NormativeSettled. The requirement holds as written.📄 Page ruleCan be applied from the page alone.Read §11.2.5 in the RFC ↗
A line chart MUST be rendered with one value per series per x position: one row per x position, one column per series, each series named by its legend entry or by its direct label at the line's end. A value printed at a point MUST be copied; every other value is read against the axis. Wiggles between x positions are not positions.
When it applies
- A line labeled directly at its end is a named series: the printed name at the line's end heads its column (see Labels (§11.1.2)).
- An x position the axis does not label is labeled by its axis value (see Cover Every Data Point (§11.1.1)).
- A labeled trend, average or reference line adds no column (see Multiple Charts and Reference Ink (§11.1.3)).
- Scenario lines that share one drawn curve early on have identical values in those positions — correct, not a copying slip.
Reading the examples. Each one pairs a source page with the output the rule expects. ✅ Sample: the rule applies. ❌ Counter-sample: it looks like it applies and does not, or a rendering got it wrong. A non-conforming output, in red, is shown only for contrast. … marks content left out of an excerpt.
Examples
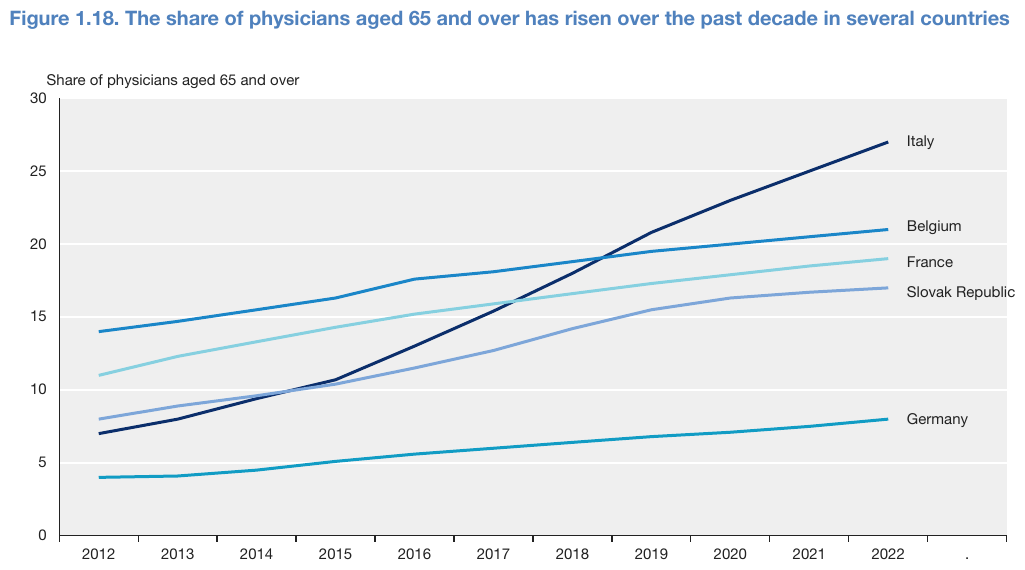
Five lines named by their direct labels over eleven labeled yearshealth-workforce-2024_p45
Five lines named by their direct labels over eleven labeled years, nothing printed on the lines:
5 × 11 = 55 values, each the line's centre at the year read against the 5-unit grid (tolerance
0.05 where the vertex sits near a gridline, 0.1 where it does not). Columns follow the direct
labels from top to bottom. The value-axis title follows the table. The axis also prints a stray .
after 2022, at a position with no line; it is not given a row.
Source page
Expected output
| Italy | Belgium | France | Slovak Republic | Germany | |
|---|---|---|---|---|---|
| 2012 | 7 | 14 | 11 | 8 | 4 |
| 2013 | 8 | 14.7 | 12.3 | 8.9 | 4.1 |
| 2014 | 9.4 | 15.5 | 13.3 | 9.6 | 4.5 |
| 2015 | 10.7 | 16.3 | 14.3 | 10.4 | 5.1 |
| 2016 | 13 | 17.6 | 15.2 | 11.5 | 5.6 |
| 2017 | 15.4 | 18.1 | 15.9 | 12.7 | 6 |
| 2018 | 18 | 18.8 | 16.6 | 14.2 | 6.4 |
| 2019 | 20.8 | 19.5 | 17.3 | 15.5 | 6.8 |
| 2020 | 23 | 20 | 17.9 | 16.3 | 7.1 |
| 2021 | 25 | 20.5 | 18.5 | 16.7 | 7.5 |
| 2022 | 27 | 21 | 19 | 17 | 8 |
Share of physicians aged 65 and over
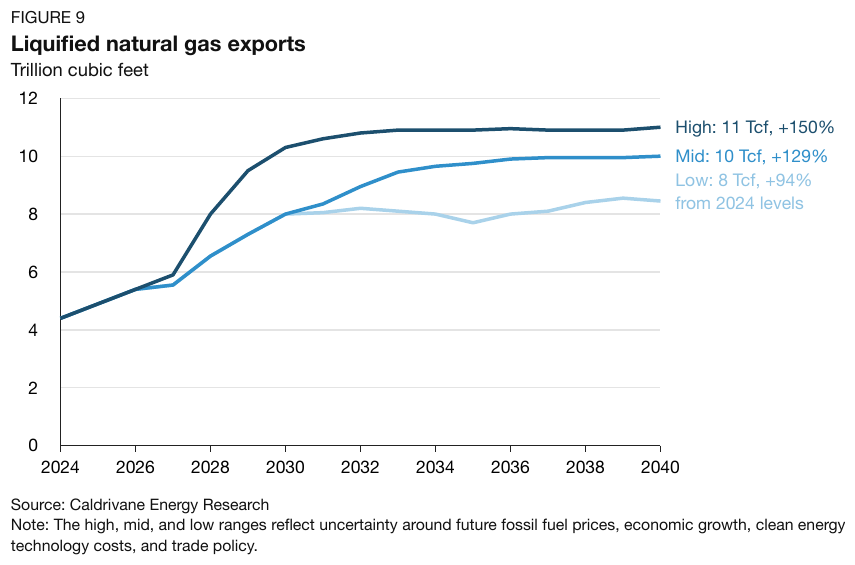
Three scenario lines named and valued by their end labels (Highenergy-outlook-2025_p20
11 Tcf, +150% …). The name part
heads each column; the rest of the label, printed at the 2040 end of the line, is that line's 2040
value, copied whole — the Low label's second line (from 2024 levels) included. The Low line
ends near 8.5 on the axis, but its printed 8 Tcf wins. Every other value is an estimate on the
2-unit grid; the shared early curve gives all three series the same values in 2024 and 2026, and
Mid and Low the same values in 2028 and 2030. The rows are the 9 printed ticks (2024–2040, every
second year): 3 × 9 = 27 values.
Source page
Expected output
Trillion cubic feet
| High | Mid | Low | |
|---|---|---|---|
| 2024 | 4.4 | 4.4 | 4.4 |
| 2026 | 5.4 | 5.4 | 5.4 |
| 2028 | 8.0 | 6.6 | 6.6 |
| 2030 | 10.3 | 8.0 | 8.0 |
| 2032 | 10.8 | 9.0 | 8.2 |
| 2034 | 10.9 | 9.7 | 8.0 |
| 2036 | 11.0 | 9.9 | 8.0 |
| 2038 | 10.9 | 10.0 | 8.4 |
| 2040 | 11 Tcf, +150% | 10 Tcf, +129% | 8 Tcf, +94% from 2024 levels |
Source: Caldrivane Energy Research Note: The high, mid, and low ranges reflect uncertainty around future fossil fuel prices, economic growth, clean energy technology costs, and trade policy.
Neighbouring rules, and how they differ
More
Rule id charts-line-charts · charts types