Split Tables Sharing a Header
Two fragments share one printed header—one table or two?
✅ NormativeSettled. The requirement holds as written.📄 Page ruleCan be applied from the page alone.Read §9.2.9 in the RFC ↗
Fragments that share a header row or a label column printed only once MUST be rendered as one table. The missing header is the proof that the second fragment was never meant to stand alone.
When it applies
A grid is sometimes printed as two or more visually separated fragments — a gap, a page-design break, a divider — with the header row or the label column printed once and not repeated in the second fragment. Read on its own, the second fragment is unreadable without the header above it, so it is not a separate table. Emitting it as a separate headerless table, or dropping it, loses the meaning of every value in it (never drop).
Printed:   | Age | Rate M | Rate F |     ← header printed once
           | 25  | 1.10   | 1.05   |

              (visual gap / band)

           | 45  | 1.42   | 1.31   |     ← no header repeated: same table
           | 55  | 1.80   | 1.66   |
This is the mirror of the repeated-header test in Repeated Headers and Title Bands (§9.2.7): a repeated header starts a new table, an unrepeated one continues the current one. Between them, header repetition is the single boundary signal on a page, read before gaps, rules or bands.
Reading the examples. Each one pairs a source page with the output the rule expects. ✅ Sample: the rule applies. ❌ Counter-sample: it looks like it applies and does not, or a rendering got it wrong. A non-conforming output, in red, is shown only for contrast. … marks content left out of an excerpt.
Examples
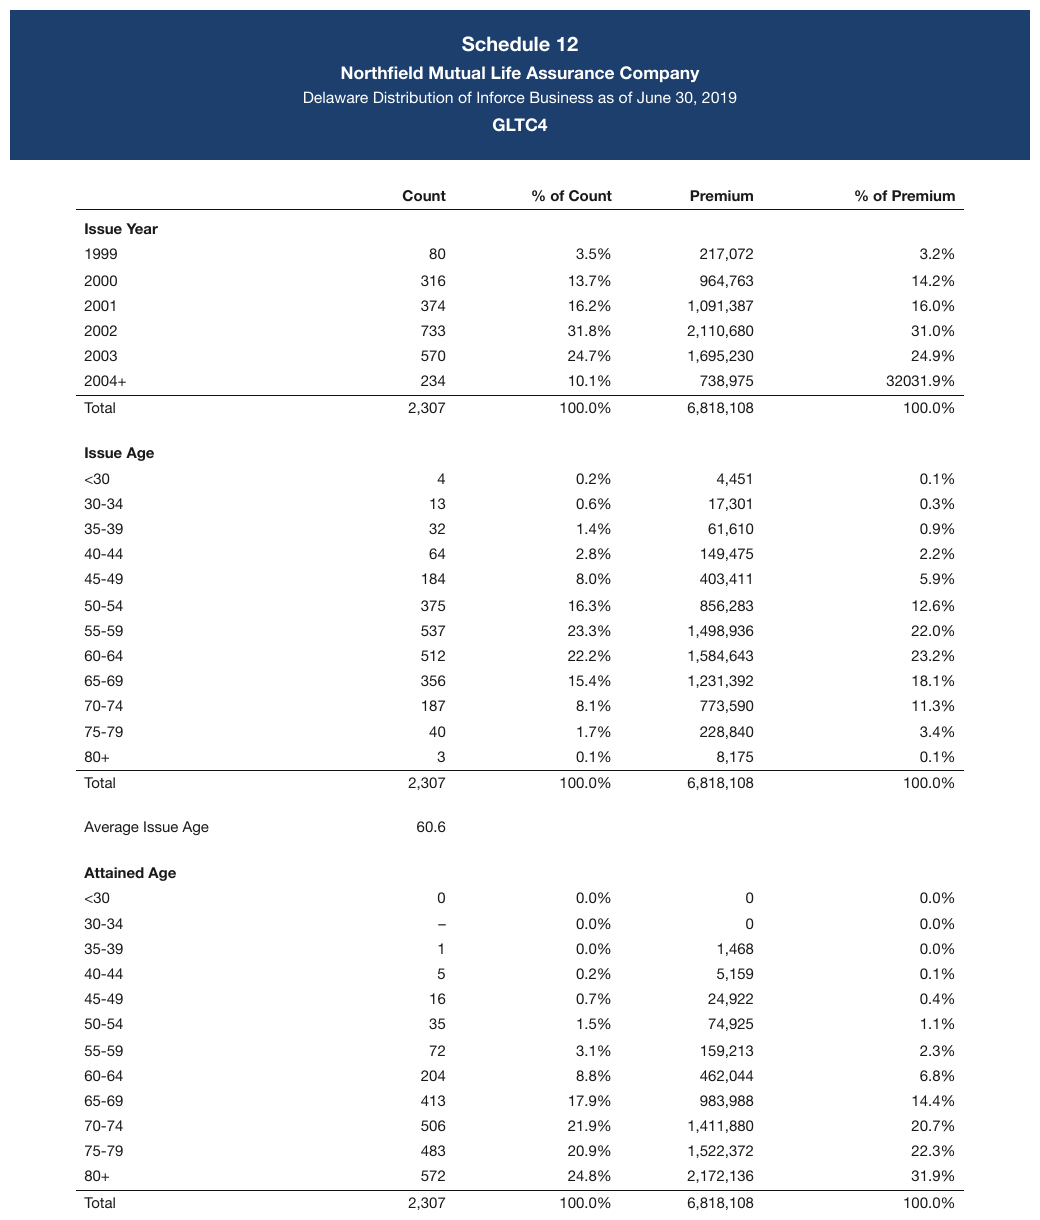
The Count / % of Count / Premium / % of Premium header row is printed once and shared…3samehead
None of the blocks below can be read on its own, so the page is one table with each cohort label as a band row.
Source page
Expected output · excerpt
| Count | % of Count | Premium | % of Premium | |||||||||||||||||||||||||||||||||||||||||||||||||||||||||||||||||||||||||||||||||||||||||||||||
|---|---|---|---|---|---|---|---|---|---|---|---|---|---|---|---|---|---|---|---|---|---|---|---|---|---|---|---|---|---|---|---|---|---|---|---|---|---|---|---|---|---|---|---|---|---|---|---|---|---|---|---|---|---|---|---|---|---|---|---|---|---|---|---|---|---|---|---|---|---|---|---|---|---|---|---|---|---|---|---|---|---|---|---|---|---|---|---|---|---|---|---|---|---|---|---|---|---|---|
| Issue Year | ||||||||||||||||||||||||||||||||||||||||||||||||||||||||||||||||||||||||||||||||||||||||||||||||||
| 1999 | 80 | 3.5% | 217,072 | 3.2% | ||||||||||||||||||||||||||||||||||||||||||||||||||||||||||||||||||||||||||||||||||||||||||||||
| 2000 | 316 | 13.7% | 964,763 | 14.2% | ||||||||||||||||||||||||||||||||||||||||||||||||||||||||||||||||||||||||||||||||||||||||||||||
| 2001 | 374 | 16.2% | 1,091,387 | 16.0% | ||||||||||||||||||||||||||||||||||||||||||||||||||||||||||||||||||||||||||||||||||||||||||||||
| 2002 | 733 | 31.8% | 2,110,680 | 31.0% | ||||||||||||||||||||||||||||||||||||||||||||||||||||||||||||||||||||||||||||||||||||||||||||||
| 2003 | 570 | 24.7% | 1,695,230 | 24.9% | ||||||||||||||||||||||||||||||||||||||||||||||||||||||||||||||||||||||||||||||||||||||||||||||
| 2004+ | 234 | 10.1% | 738,975 | 32031.9% | ||||||||||||||||||||||||||||||||||||||||||||||||||||||||||||||||||||||||||||||||||||||||||||||
| Total | 2,307 | 100.0% | 6,818,108 | 100.0% | ||||||||||||||||||||||||||||||||||||||||||||||||||||||||||||||||||||||||||||||||||||||||||||||
| Issue Age | ||||||||||||||||||||||||||||||||||||||||||||||||||||||||||||||||||||||||||||||||||||||||||||||||||
| <30 | 4 | 0.2% | 4,451 | 0.1% | ||||||||||||||||||||||||||||||||||||||||||||||||||||||||||||||||||||||||||||||||||||||||||||||
| … | ||||||||||||||||||||||||||||||||||||||||||||||||||||||||||||||||||||||||||||||||||||||||||||||||||
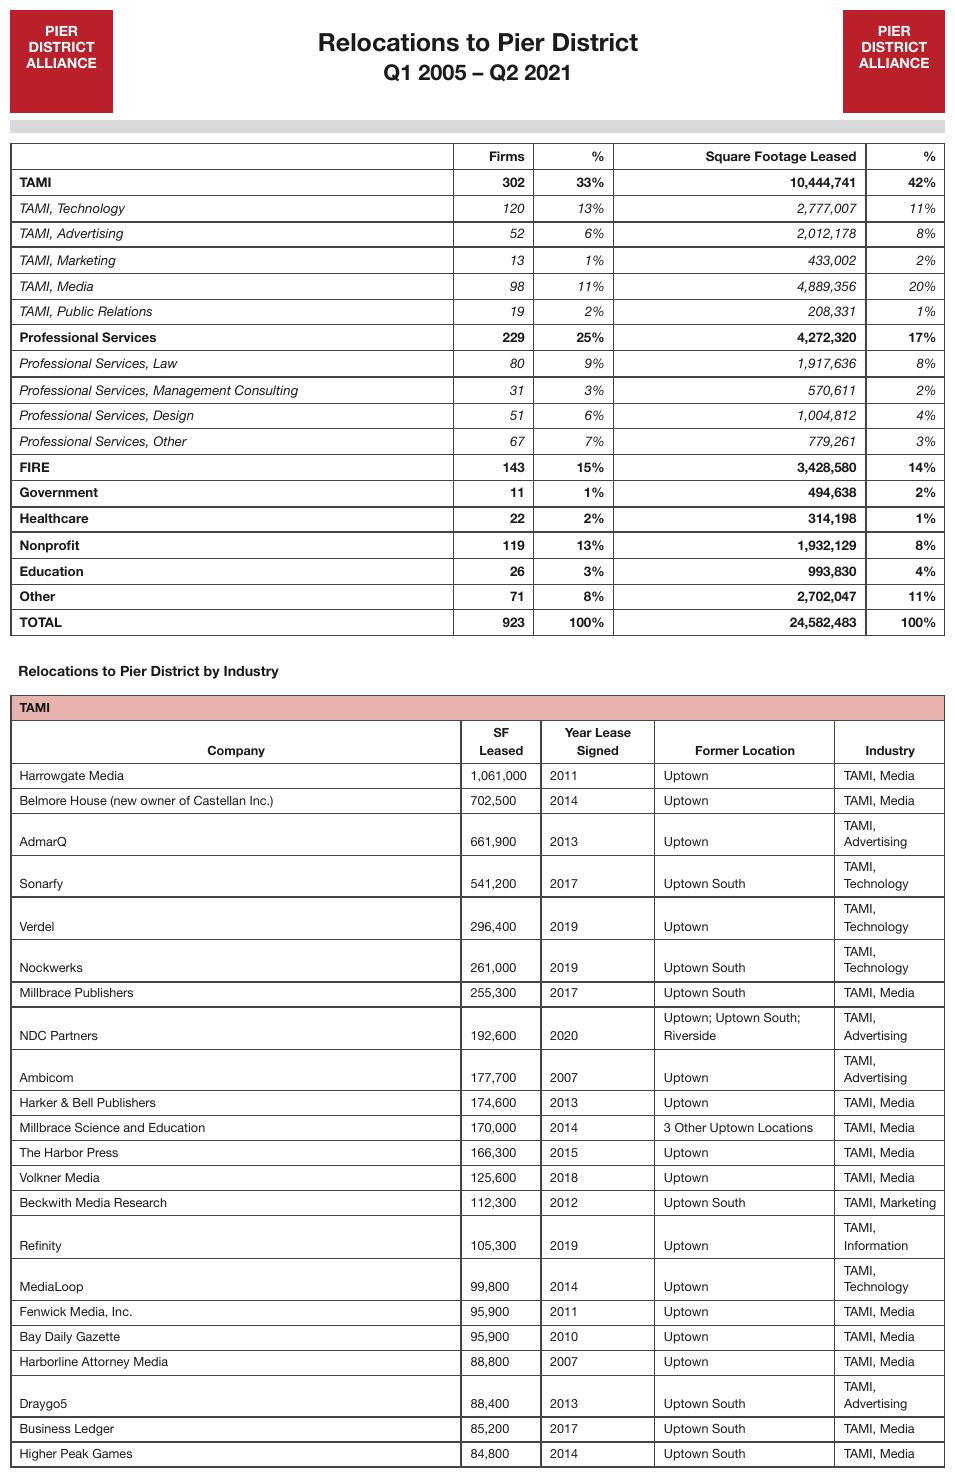
A company-relocation list whose header row is printed once here…dt1
A company-relocation list whose header row is printed once here…
Source page
Expected output · table 2 of 2, excerpt
| TAMI | ||||||||||||||||||||||||||||||||||||||||||||||||||||||||||||||||||||||||||||||||||||||||||||||||||
|---|---|---|---|---|---|---|---|---|---|---|---|---|---|---|---|---|---|---|---|---|---|---|---|---|---|---|---|---|---|---|---|---|---|---|---|---|---|---|---|---|---|---|---|---|---|---|---|---|---|---|---|---|---|---|---|---|---|---|---|---|---|---|---|---|---|---|---|---|---|---|---|---|---|---|---|---|---|---|---|---|---|---|---|---|---|---|---|---|---|---|---|---|---|---|---|---|---|---|
| Company | SF Leased | Year Lease Signed | Former Location | Industry | ||||||||||||||||||||||||||||||||||||||||||||||||||||||||||||||||||||||||||||||||||||||||||||||
| Harrowgate Media | 1,061,000 | 2011 | Uptown | TAMI, Media | ||||||||||||||||||||||||||||||||||||||||||||||||||||||||||||||||||||||||||||||||||||||||||||||
| Belmore House (new owner of Castellan Inc.) | 702,500 | 2014 | Uptown | TAMI, Media | ||||||||||||||||||||||||||||||||||||||||||||||||||||||||||||||||||||||||||||||||||||||||||||||
| AdmarQ | 661,900 | 2013 | Uptown | TAMI, Advertising | ||||||||||||||||||||||||||||||||||||||||||||||||||||||||||||||||||||||||||||||||||||||||||||||
| Sonarfy | 541,200 | 2017 | Uptown South | TAMI, Technology | ||||||||||||||||||||||||||||||||||||||||||||||||||||||||||||||||||||||||||||||||||||||||||||||
| … | ||||||||||||||||||||||||||||||||||||||||||||||||||||||||||||||||||||||||||||||||||||||||||||||||||
| NDC Partners | 192,600 | 2020 | Uptown; Uptown South; Riverside | TAMI, Advertising | ||||||||||||||||||||||||||||||||||||||||||||||||||||||||||||||||||||||||||||||||||||||||||||||
| … | ||||||||||||||||||||||||||||||||||||||||||||||||||||||||||||||||||||||||||||||||||||||||||||||||||
| Draygo5 | 88,400 | 2013 | Uptown South | TAMI, Advertising | ||||||||||||||||||||||||||||||||||||||||||||||||||||||||||||||||||||||||||||||||||||||||||||||
| Business Ledger | 85,200 | 2017 | Uptown South | TAMI, Media | ||||||||||||||||||||||||||||||||||||||||||||||||||||||||||||||||||||||||||||||||||||||||||||||
| Higher Peak Games | 84,800 | 2014 | Uptown South | TAMI, Media | ||||||||||||||||||||||||||||||||||||||||||||||||||||||||||||||||||||||||||||||||||||||||||||||
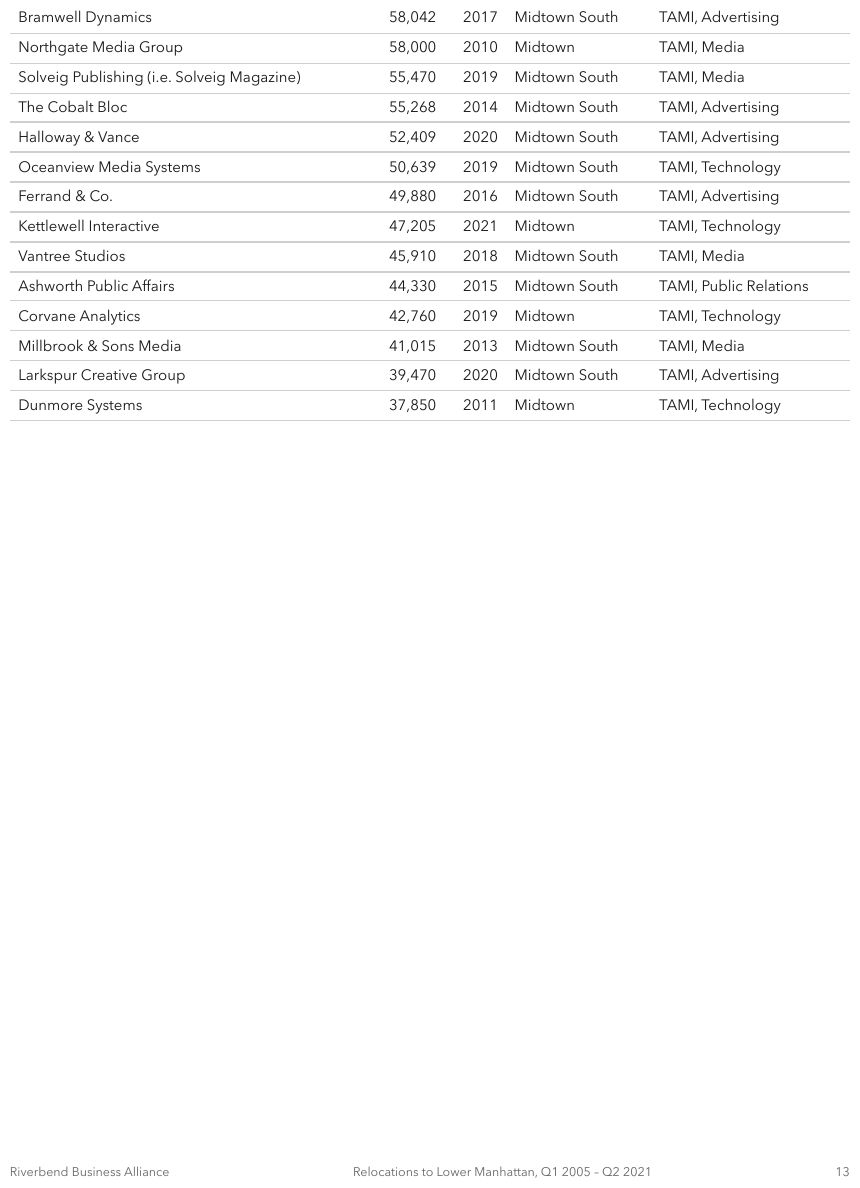
…and continues onto the next page with no header row at alldt2
the fragment depends on the header printed on the page before. Across a page break the fragments stay on their own pages — see Cross-Page Tables (§4.3) — so this page's fragment is rendered headerless and carries the continuation flags instead of a copied header.
Source page
Expected output · the table
| Bramwell Dynamics | 58,042 | 2017 | Midtown South | TAMI, Advertising |
| Northgate Media Group | 58,000 | 2010 | Midtown | TAMI, Media |
| Solveig Publishing (i.e. Solveig Magazine) | 55,470 | 2019 | Midtown South | TAMI, Media |
| The Cobalt Bloc | 55,268 | 2014 | Midtown South | TAMI, Advertising |
| Halloway & Vance | 52,409 | 2020 | Midtown South | TAMI, Advertising |
| Oceanview Media Systems | 50,639 | 2019 | Midtown South | TAMI, Technology |
| Ferrand & Co. | 49,880 | 2016 | Midtown South | TAMI, Advertising |
| Kettlewell Interactive | 47,205 | 2021 | Midtown | TAMI, Technology |
| Vantree Studios | 45,910 | 2018 | Midtown South | TAMI, Media |
| Ashworth Public Affairs | 44,330 | 2015 | Midtown South | TAMI, Public Relations |
| Corvane Analytics | 42,760 | 2019 | Midtown | TAMI, Technology |
| Millbrook & Sons Media | 41,015 | 2013 | Midtown South | TAMI, Media |
| Larkspur Creative Group | 39,470 | 2020 | Midtown South | TAMI, Advertising |
| Dunmore Systems | 37,850 | 2011 | Midtown | TAMI, Technology |
Two cases that need judgement
Something sits in the gap. A band row, a caption or a paragraph between the fragments does not automatically break the table. The fragments MUST be merged as long as the second one still depends on the header above it; a heading printed in the gap becomes a band row inside the one table.
The shared piece is the label column. Side-by-side fragments with the row labels printed once on the left and value blocks separated by a gutter follow the same test: the value blocks cannot be read without those labels, so they MUST be rendered as one table. Every printed value MUST be kept, with the blocks placed as further columns of the labelled table.
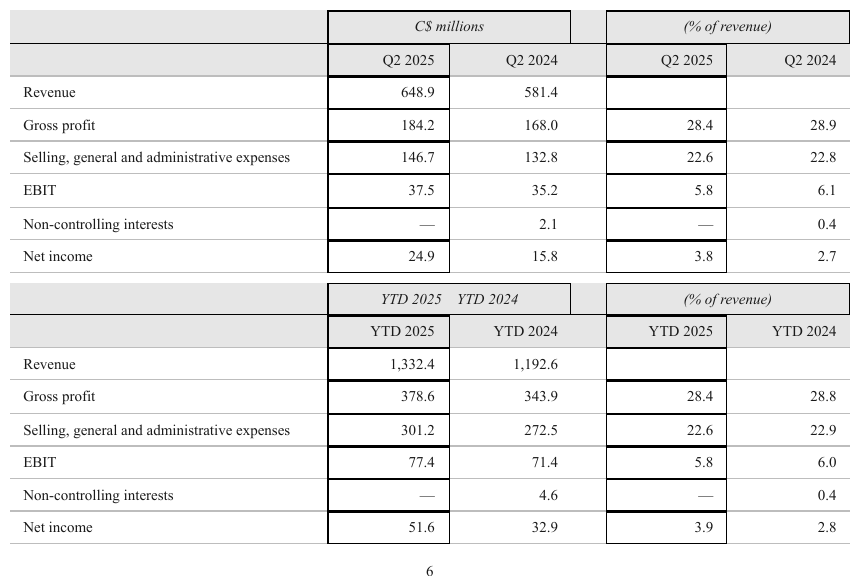
one label column, two value blocks
A quarterly summary printed as one row-label column on the left — Revenue, Gross profit,
Selling, general and administrative expenses, EBIT, Non-controlling interests, Net income —
feeding two separately boxed value blocks: C$ millions and (% of revenue), each with its
own Q2 2025 / Q2 2024 header pair.
The right-hand block has no row labels of its own. Read on its own it is ten unnamed values, which is the proof that the two fragments were never meant to stand apart. The same structure is printed again below for the year-to-date figures, with its header rows repeated, so that block is a second table.
The blocks do not share a header row: each has its own. It is the label column that is
printed once — the mirror sub-case. The em-dashes in the Non-controlling interests rows are
values, not blanks (Marks and Symbols in Cells (§9.6.6)), and (% of revenue) is a units line in the
header (Units Row (§9.3.5)). The empty gutter between the blocks is not a column (Gutter Columns (§9.4.1)).
Source page
Expected output · table 1 of 2
| C$ millions | (% of revenue) | |||
|---|---|---|---|---|
| Q2 2025 | Q2 2024 | Q2 2025 | Q2 2024 | |
| Revenue | 648.9 | 581.4 | ||
| Gross profit | 184.2 | 168.0 | 28.4 | 28.9 |
| Selling, general and administrative expenses | 146.7 | 132.8 | 22.6 | 22.8 |
| EBIT | 37.5 | 35.2 | 5.8 | 6.1 |
| Non-controlling interests | — | 2.1 | — | 0.4 |
| Net income | 24.9 | 15.8 | 3.8 | 2.7 |
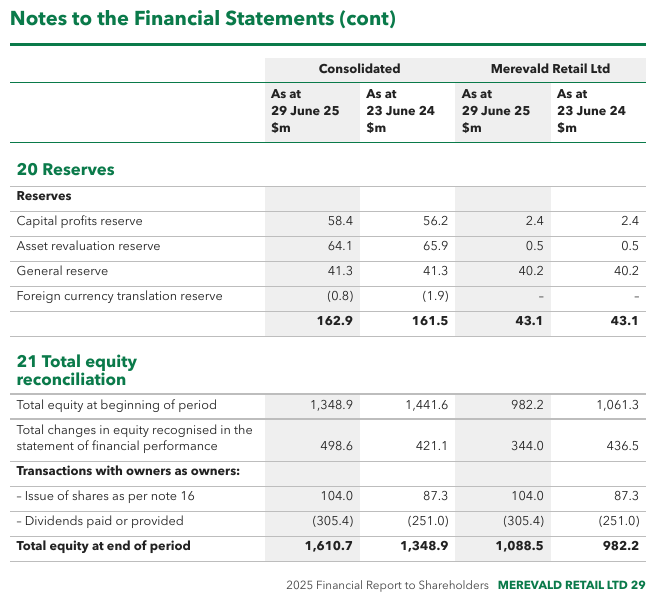
a numbered note heading in the gap
The four-column header (Consolidated / Merevald Retail Ltd, two dates each) is printed once at
the top. Note 20 Reserves and note 21 Total equity reconciliation both sit under it, separated
by the second note's heading. Neither fragment repeats the header, so it is one table, and each
note heading is a band row inside it.
Source page
Expected output
| Consolidated | Merevald Retail Ltd | |||
|---|---|---|---|---|
| As at 29 June 25 $m | As at 23 June 24 $m | As at 29 June 25 $m | As at 23 June 24 $m | |
| 20 Reserves | ||||
| Reserves | ||||
| Capital profits reserve | 58.4 | 56.2 | 2.4 | 2.4 |
| Asset revaluation reserve | 64.1 | 65.9 | 0.5 | 0.5 |
| General reserve | 41.3 | 41.3 | 40.2 | 40.2 |
| Foreign currency translation reserve | (0.8) | (1.9) | – | – |
| 162.9 | 161.5 | 43.1 | 43.1 | |
| 21 Total equity reconciliation | ||||
| Total equity at beginning of period | 1,348.9 | 1,441.6 | 982.2 | 1,061.3 |
| Total changes in equity recognised in the statement of financial performance | 498.6 | 421.1 | 344.0 | 436.5 |
| Transactions with owners as owners: | ||||
| – Issue of shares as per note 16 | 104.0 | 87.3 | 104.0 | 87.3 |
| – Dividends paid or provided | (305.4) | (251.0) | (305.4) | (251.0) |
| Total equity at end of period | 1,610.7 | 1,348.9 | 1,088.5 | 982.2 |
Neighbouring rules, and how they differ
More
Rule id tables-split-tables-sharing-a-header · tables boundaries headers proposed-rule