Gantt and Sankey Charts
A span or a flow instead of a point—how is it recorded?
✅ NormativeSettled. The requirement holds as written.📄 Page ruleCan be applied from the page alone.Read §11.2.3 in the RFC ↗
A gantt chart MUST be rendered with one row per mark, giving the mark's label, its start and its end on the time axis — for a milestone, start and end are the same period. A sankey diagram MUST be rendered with one row per flow, giving its source node, its target node and the value it carries. Each family uses its one shape throughout, whatever the chart prints.
Reading the examples. Each one pairs a source page with the output the rule expects. ✅ Sample: the rule applies. ❌ Counter-sample: it looks like it applies and does not, or a rendering got it wrong. A non-conforming output, in red, is shown only for contrast. … marks content left out of an excerpt.
Gantt
The time axis is the value axis. Each bar's two edges are read against the printed ticks and
written as the periods the axis prints: months as month tokens (Jan), quarters under year headers
as quarter tokens with their year (Q1 2025). When the page prints exact dates for each task, those
printed dates are the start and end; when it prints them as a table beside the bars, that printed
table is the rendering and the bars add nothing to it (see Chart With a Printed Data Grid (§9.1.2)).
Nothing on the page prints the words start or end, and they MUST NOT be invented as labels of a mark; the pair lives in the row's two period cells.
How a gantt row is laid out. A gantt chart MUST be one table with one row per task bar or
milestone, in the chart's top-to-bottom order: the printed label, the start period, the end period.
Its header row MUST be Start | End over the two period columns, with the first cell holding the
printed label column's title or left empty. These header cells are protocol vocabulary, like the markers [blank] or [logo: …]: the page does
not print them, and they are the one deliberate exception to never invent, so that the columns
can be read without guessing. They are written exactly as given.
A bar edge on a period boundary. A bar that fills January through March has its right edge on
the April tick. Its end MUST be the last period the bar visibly fills (Mar), and one
reading MUST be used throughout a document (see Choices Made Once Per Document (§4.2)). A checker
accepts a reading one boundary off.
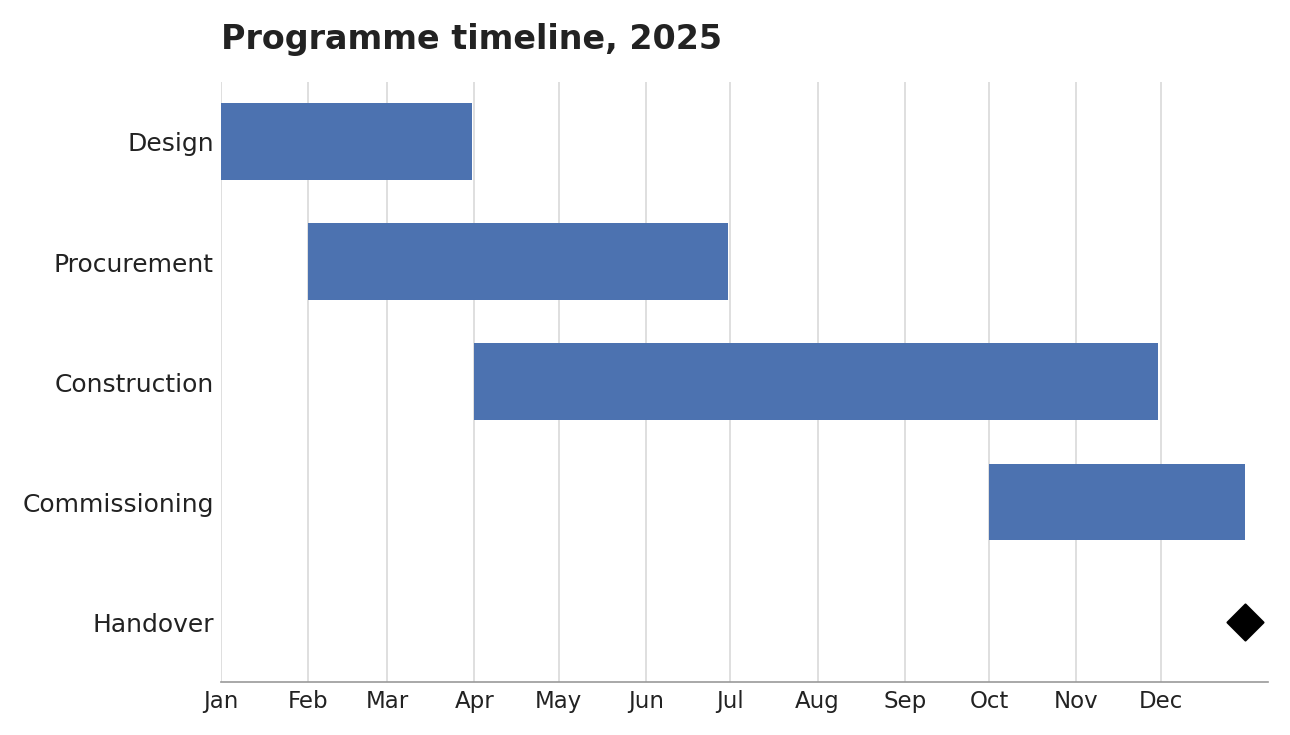
Four task bars and a diamond milestone on a month axismake_gantt
five rows, the milestone with start and end
both Dec. Design fills January to March and its end is Mar, the last month it fills.
Source page
Expected output
| Start | End | |
|---|---|---|
| Design | Jan | Mar |
| Procurement | Feb | Jun |
| Construction | Apr | Nov |
| Commissioning | Oct | Dec |
| Handover | Dec | Dec |
Four task barsmetro_s2_p18
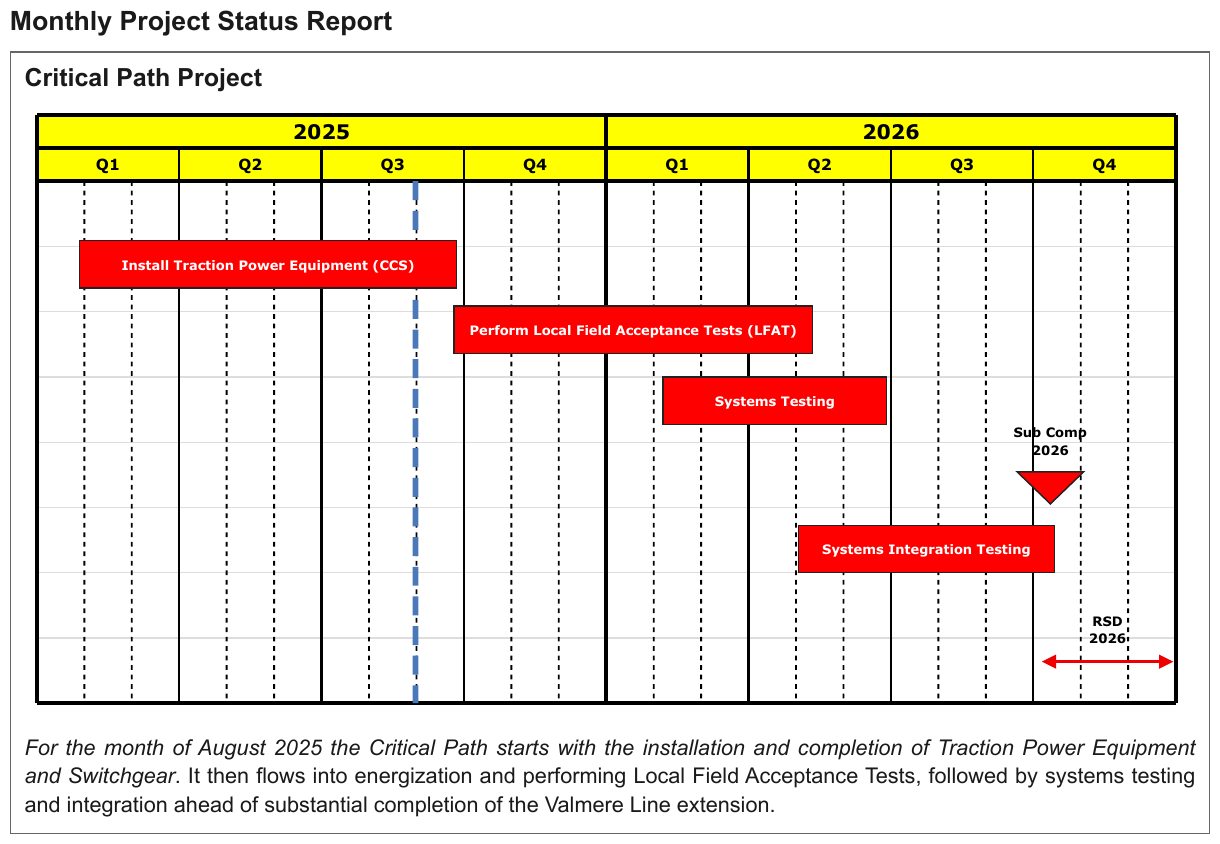
Four task bars, one milestone and the revenue-service window on a quarter axis under two year
headers — six rows in the chart's top-to-bottom order. The Sub Comp 2026 down-triangle is a
single-position mark, so start and end are the same quarter; the double-headed RSD 2026 arrow
spans the Q4 2026 column, both its edges in one quarter, so it too resolves to one period. A mark
whose two edges fall in one quarter still gets its row. The dashed vertical line is a status marker
with no label and adds nothing. The labels are printed in bold; the report headings above the chart
are elided.
Source page
Expected output · excerpt
…
| Start | End | |
|---|---|---|
| Install Traction Power Equipment (CCS) | Q1 2025 | Q3 2025 |
| Perform Local Field Acceptance Tests (LFAT) | Q3 2025 | Q2 2026 |
| Systems Testing | Q1 2026 | Q2 2026 |
| Sub Comp 2026 | Q4 2026 | Q4 2026 |
| Systems Integration Testing | Q2 2026 | Q4 2026 |
| RSD 2026 | Q4 2026 | Q4 2026 |
For the month of August 2025 the Critical Path starts with the installation and completion of Traction Power Equipment and Switchgear. It then flows into energization and performing Local Field Acceptance Tests, followed by systems testing and integration ahead of substantial completion of the Valmere Line extension.
A schedule whose left-hand table prints each activity's IDguideway_schedule_p100
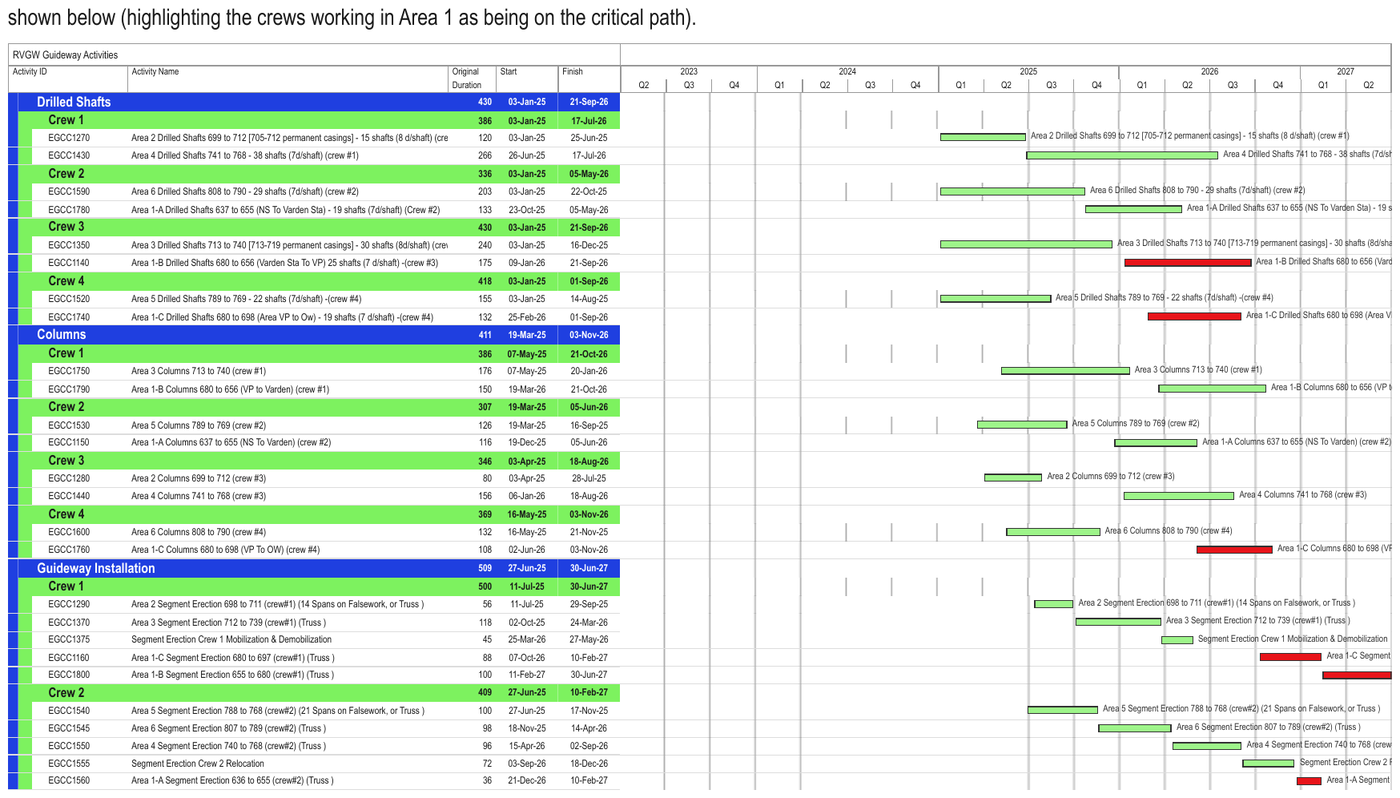
A schedule whose left-hand table prints each activity's ID, name, duration, start and finish:
that printed table is the rendering, with its printed dates as the span of each bar, and the bar
area to its right — year and quarter headers, bars, bar labels — adds nothing. The table lists
26 activities under group and crew bands. Long names are clipped at the edge of the name
column and are written as far as they are visible ((cre on EGCC1270; on EGCC1350 the next
letter is cut mid-glyph and left out). The first five activities are shown.
Source page
Expected output · excerpt
shown below (highlighting the crews working in Area 1 as being on the critical path).
| RVGW Guideway Activities | ||||||||||||||||||||||||||||||||||||||||||||||||||||||||||||||||||||||||||||||||||||||||||||||||||
|---|---|---|---|---|---|---|---|---|---|---|---|---|---|---|---|---|---|---|---|---|---|---|---|---|---|---|---|---|---|---|---|---|---|---|---|---|---|---|---|---|---|---|---|---|---|---|---|---|---|---|---|---|---|---|---|---|---|---|---|---|---|---|---|---|---|---|---|---|---|---|---|---|---|---|---|---|---|---|---|---|---|---|---|---|---|---|---|---|---|---|---|---|---|---|---|---|---|---|
| Activity ID | Activity Name | Original Duration | Start | Finish | ||||||||||||||||||||||||||||||||||||||||||||||||||||||||||||||||||||||||||||||||||||||||||||||
| Drilled Shafts | 430 | 03-Jan-25 | 21-Sep-26 | |||||||||||||||||||||||||||||||||||||||||||||||||||||||||||||||||||||||||||||||||||||||||||||||
| Crew 1 | 386 | 03-Jan-25 | 17-Jul-26 | |||||||||||||||||||||||||||||||||||||||||||||||||||||||||||||||||||||||||||||||||||||||||||||||
| EGCC1270 | Area 2 Drilled Shafts 699 to 712 [705-712 permanent casings] - 15 shafts (8 d/shaft) (cre | 120 | 03-Jan-25 | 25-Jun-25 | ||||||||||||||||||||||||||||||||||||||||||||||||||||||||||||||||||||||||||||||||||||||||||||||
| EGCC1430 | Area 4 Drilled Shafts 741 to 768 - 38 shafts (7d/shaft) (crew #1) | 266 | 26-Jun-25 | 17-Jul-26 | ||||||||||||||||||||||||||||||||||||||||||||||||||||||||||||||||||||||||||||||||||||||||||||||
| Crew 2 | 336 | 03-Jan-25 | 05-May-26 | |||||||||||||||||||||||||||||||||||||||||||||||||||||||||||||||||||||||||||||||||||||||||||||||
| EGCC1590 | Area 6 Drilled Shafts 808 to 790 - 29 shafts (7d/shaft) (crew #2) | 203 | 03-Jan-25 | 22-Oct-25 | ||||||||||||||||||||||||||||||||||||||||||||||||||||||||||||||||||||||||||||||||||||||||||||||
| EGCC1780 | Area 1-A Drilled Shafts 637 to 655 (NS To Varden Sta) - 19 shafts (7d/shaft) (Crew #2) | 133 | 23-Oct-25 | 05-May-26 | ||||||||||||||||||||||||||||||||||||||||||||||||||||||||||||||||||||||||||||||||||||||||||||||
| Crew 3 | 430 | 03-Jan-25 | 21-Sep-26 | |||||||||||||||||||||||||||||||||||||||||||||||||||||||||||||||||||||||||||||||||||||||||||||||
| EGCC1350 | Area 3 Drilled Shafts 713 to 740 [713-719 permanent casings] - 30 shafts (8d/shaft) (cre | 240 | 03-Jan-25 | 16-Dec-25 | ||||||||||||||||||||||||||||||||||||||||||||||||||||||||||||||||||||||||||||||||||||||||||||||
| … | ||||||||||||||||||||||||||||||||||||||||||||||||||||||||||||||||||||||||||||||||||||||||||||||||||
Sankey
A flow's value is the number it carries. Where only node totals are printed, a node with a single inflow or a single outflow gives that one flow its value, and the flow takes the same row shape. A node that both splits and merges has no single flow its total belongs to: its total gives no flow row, and its printed total is kept as text. A sankey that prints no values has no readable flows: ribbon widths MUST NOT be estimated.
Node names in the source and target cells are copied without any printed node total. A ribbon is traced from end to end before its row is written — values often print at the ribbon's start, far from the target node, and a thin ribbon can pass under several others. A ribbon that cannot be traced unambiguously gets no row.
How a sankey flow is laid out. A sankey diagram MUST be one table with one row per flow,
ordered by source from top to bottom and then by target, under the header row Source | Target |
Value. Each printed node total that is not any one flow's value follows the table as text, as
printed (Industry 165). These header cells are protocol vocabulary, like the markers [blank] or [logo: …]: the page does
not print them, and they are the one deliberate exception to never invent, so that the columns
can be read without guessing. They are written exactly as given.
Every ribbon prints its valuemake_sankey
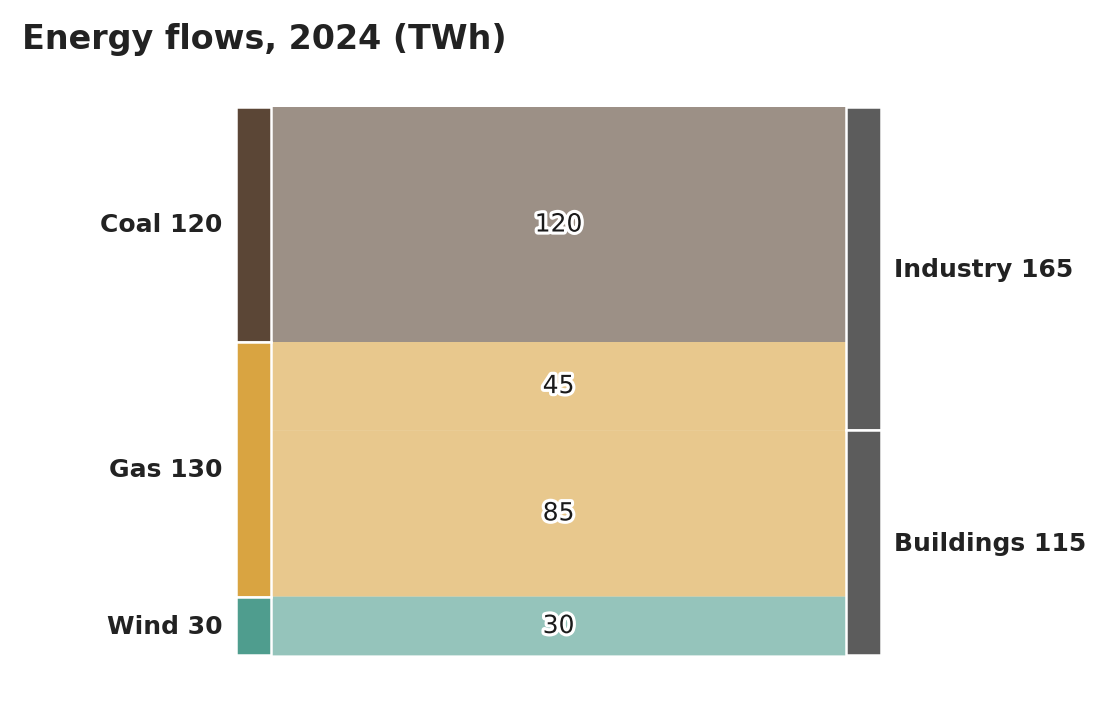
four rows. Coal 120 and Wind 30 each feed a single flow, so their
totals are already the flows' values; Gas 130, Industry 165 and Buildings 115 each join or
split several flows, and their printed totals follow the table. The (TWh) in the printed title
stays in the title. Node labels are printed in bold.
Source page
Expected output
| Source | Target | Value |
|---|---|---|
| Coal | Industry | 120 |
| Gas | Industry | 45 |
| Gas | Buildings | 85 |
| Wind | Buildings | 30 |
Gas 130
Industry 165
Buildings 115
About 45 ribbons, each printing its own value in quadsllnl_energy_2023_p1
one row per ribbon. Six of them, thick and thin, are shown; the rest of the table, the node totals that are no single flow's value, and the source note are elided. All text on this chart is printed in bold.
Source page
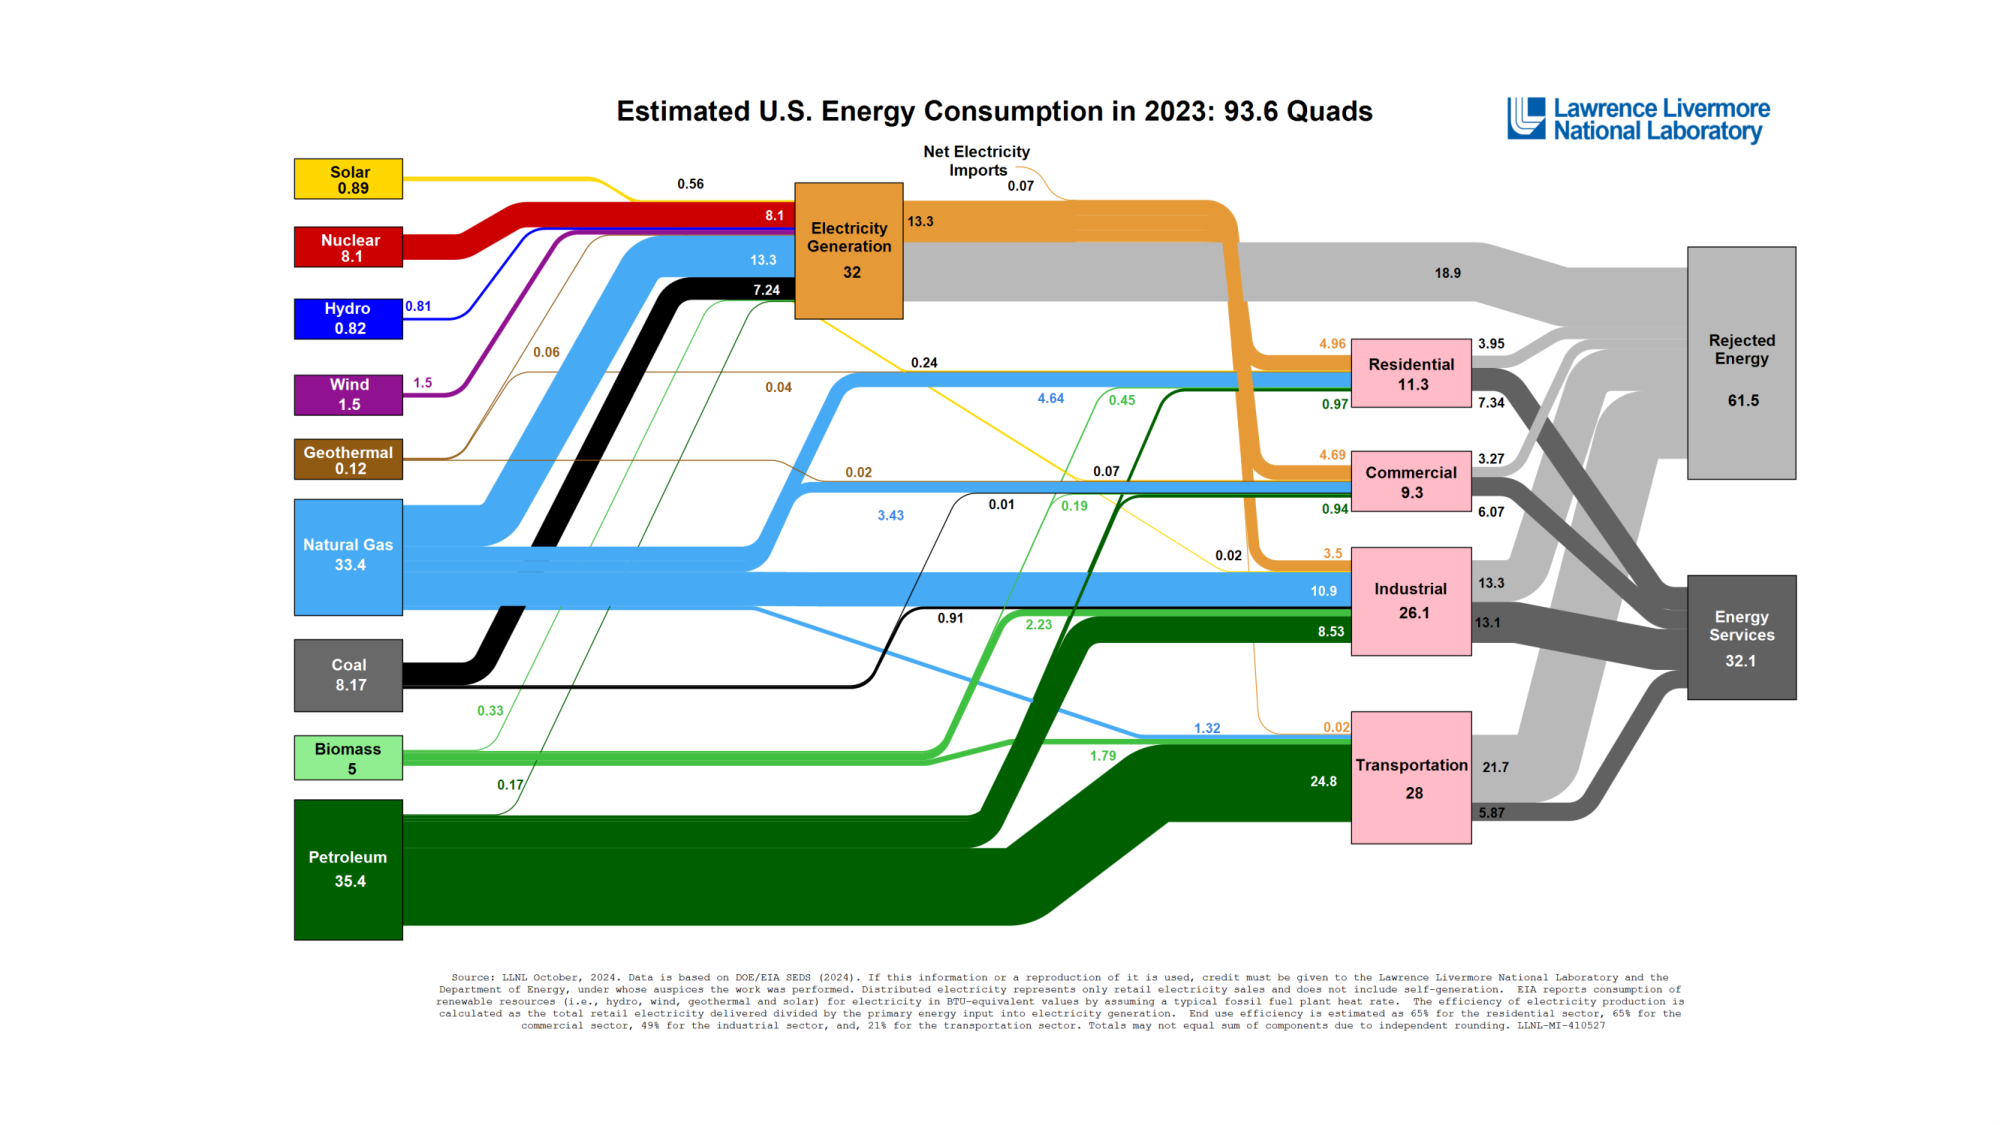
Source: Lawrence Livermore National Laboratory, U.S. Department of Energy — Estimated U.S. Energy Consumption in 2023 (public domain)
Expected output · excerpt
| Source | Target | Value | ||||||||||||||||||||||||||||||||||||||||||||||||||||||||||||||||||||||||||||||||||||||||||||||||
|---|---|---|---|---|---|---|---|---|---|---|---|---|---|---|---|---|---|---|---|---|---|---|---|---|---|---|---|---|---|---|---|---|---|---|---|---|---|---|---|---|---|---|---|---|---|---|---|---|---|---|---|---|---|---|---|---|---|---|---|---|---|---|---|---|---|---|---|---|---|---|---|---|---|---|---|---|---|---|---|---|---|---|---|---|---|---|---|---|---|---|---|---|---|---|---|---|---|---|
| Solar | Electricity Generation | 0.56 | ||||||||||||||||||||||||||||||||||||||||||||||||||||||||||||||||||||||||||||||||||||||||||||||||
| Nuclear | Electricity Generation | 8.1 | ||||||||||||||||||||||||||||||||||||||||||||||||||||||||||||||||||||||||||||||||||||||||||||||||
| Natural Gas | Industrial | 10.9 | ||||||||||||||||||||||||||||||||||||||||||||||||||||||||||||||||||||||||||||||||||||||||||||||||
| Coal | Industrial | 0.91 | ||||||||||||||||||||||||||||||||||||||||||||||||||||||||||||||||||||||||||||||||||||||||||||||||
| Petroleum | Transportation | 24.8 | ||||||||||||||||||||||||||||||||||||||||||||||||||||||||||||||||||||||||||||||||||||||||||||||||
| Electricity Generation | Residential | 4.96 | ||||||||||||||||||||||||||||||||||||||||||||||||||||||||||||||||||||||||||||||||||||||||||||||||
| … | ||||||||||||||||||||||||||||||||||||||||||||||||||||||||||||||||||||||||||||||||||||||||||||||||||
…
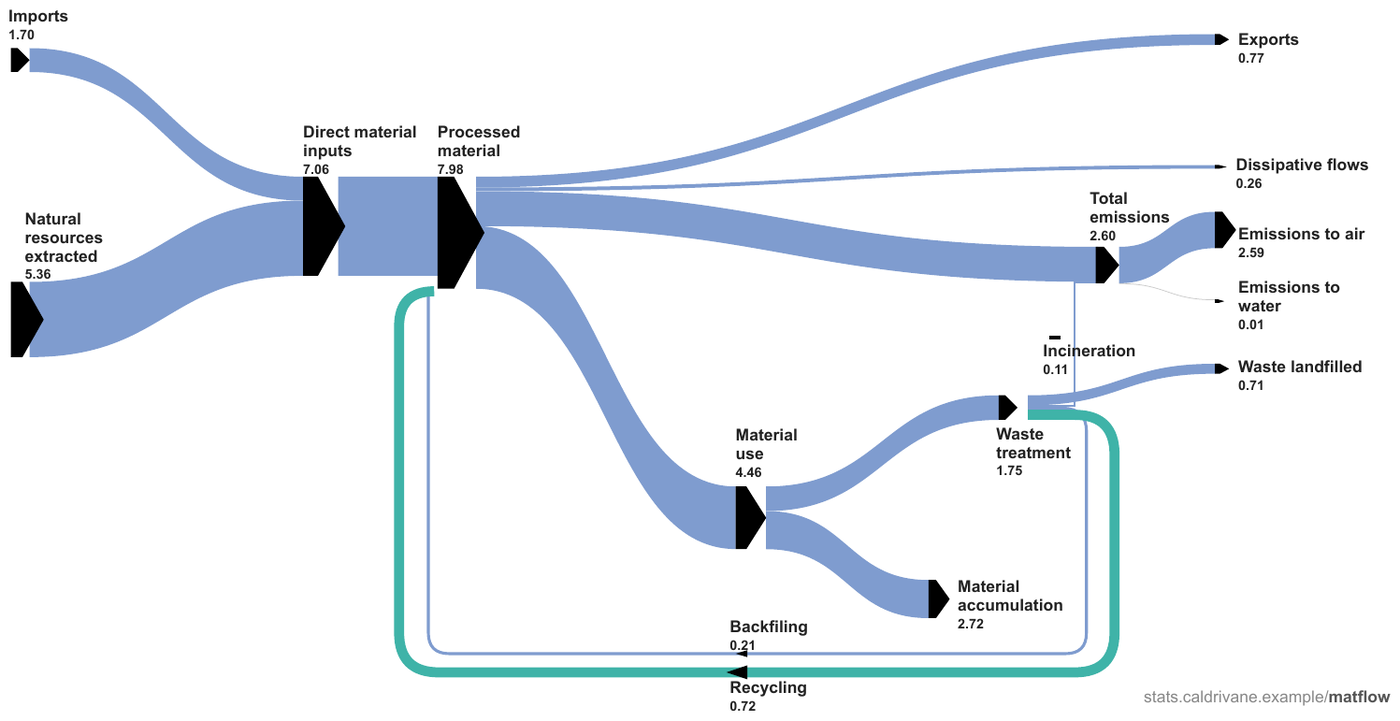
Nothing prints on the ribbons — every number is a node totalmaterial-flows-2020_p4
Where a node has a single inflow
or a single outflow, its total is that one flow's value: fourteen flows are read out this way, in
the same row shape as a chart whose ribbons print values. Processed material (7.98) and
Total emissions (2.60) each merge several inflows and split into several outflows, so their
totals are no single flow's value: they give no row and follow the table as printed. Backfiling
is copied as printed. All chart text is printed in bold.
Source page
Expected output
| Source | Target | Value |
|---|---|---|
| Imports | Direct material inputs | 1.70 |
| Natural resources extracted | Direct material inputs | 5.36 |
| Direct material inputs | Processed material | 7.06 |
| Processed material | Exports | 0.77 |
| Processed material | Dissipative flows | 0.26 |
| Processed material | Material use | 4.46 |
| Total emissions | Emissions to air | 2.59 |
| Total emissions | Emissions to water | 0.01 |
| Material use | Material accumulation | 2.72 |
| Material use | Waste treatment | 1.75 |
| Waste treatment | Waste landfilled | 0.71 |
| Waste treatment | Incineration | 0.11 |
| Waste treatment | Recycling | 0.72 |
| Waste treatment | Backfiling | 0.21 |
Processed material 7.98
Total emissions 2.60
stats.caldrivane.example/matflow
How a checker judges spans and flows
A gantt span and a sankey flow are judged on meaning, not on a table shape: a checker accepts any output that conveys both endpoints of a span at the granularity the axis prints — a positional grid correctly aligned to the periods included — and accepts a span end one period boundary off. A flow is accepted wherever the output conveys its source, its target and its value together. A flow or span whose parts are scattered so that they can no longer be paired is not conveyed.
Neighbouring rules, and how they differ
More
Sample sources1 +
Public-domain U.S. federal government source material.
- Lawrence Livermore National Laboratory, U.S. Department of Energy — Estimated U.S. Energy Consumption in 2023
Rule id charts-gantt-and-sankey-charts · charts types