Multi-Row Header Tiers
Several header rows—keep the tiers or flatten them?
✅ NormativeSettled. The requirement holds as written.📄 Page ruleCan be applied from the page alone.Read §9.3.3 in the RFC ↗
Every printed header tier MUST be rendered as its own header row, with exact colspans. A group
header MUST span only its data columns; the row-label stub takes a rowspan across the header rows
instead.
When it applies
Printed:  |            BI          |            PD          |
          | Indicated  | Proposed  | Indicated  | Proposed  |
Reading the examples. Each one pairs a source page with the output the rule expects. ✅ Sample: the rule applies. ❌ Counter-sample: it looks like it applies and does not, or a rendering got it wrong. A non-conforming output, in red, is shown only for contrast. … marks content left out of an excerpt.
Every real tier is kept
Both rows are rendered with their spans — [colspan=2]BI over Indicated | Proposed, and so on.
The stack MUST NOT be flattened into one row of concatenated labels: "BI Indicated", "BI Proposed" is non-conforming, not a stylistic choice. It destroys the grouping that the page printed and makes the number of header rows depend on the producer rather than the page.
A wrapped parent phrase is still a tier. "(Paid as of 12-31-2020)" broken across two lines and spanning its sub-columns is a genuine tier — "it wrapped" does not demote it. The span, not the line count, decides; Header Wrap vs Real Tier (§9.3.2) has the full test.
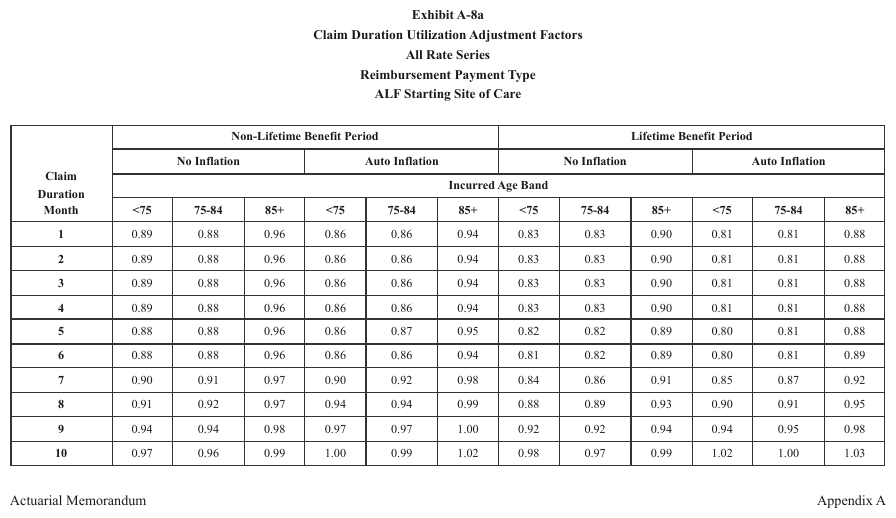
Four stacked header rows5lineperrow
benefit period › inflation › Incurred Age Band › <75 / 75-84 / 85+
repeated four times. The stub label spans all four header rows; the month numbers are bold.
Source page
Expected output
| Claim Duration Month | Non-Lifetime Benefit Period | Lifetime Benefit Period | ||||||||||
|---|---|---|---|---|---|---|---|---|---|---|---|---|
| No Inflation | Auto Inflation | No Inflation | Auto Inflation | |||||||||
| Incurred Age Band | ||||||||||||
| <75 | 75-84 | 85+ | <75 | 75-84 | 85+ | <75 | 75-84 | 85+ | <75 | 75-84 | 85+ | |
| 1 | 0.89 | 0.88 | 0.96 | 0.86 | 0.86 | 0.94 | 0.83 | 0.83 | 0.90 | 0.81 | 0.81 | 0.88 |
| 2 | 0.89 | 0.88 | 0.96 | 0.86 | 0.86 | 0.94 | 0.83 | 0.83 | 0.90 | 0.81 | 0.81 | 0.88 |
| 3 | 0.89 | 0.88 | 0.96 | 0.86 | 0.86 | 0.94 | 0.83 | 0.83 | 0.90 | 0.81 | 0.81 | 0.88 |
| 4 | 0.89 | 0.88 | 0.96 | 0.86 | 0.86 | 0.94 | 0.83 | 0.83 | 0.90 | 0.81 | 0.81 | 0.88 |
| 5 | 0.88 | 0.88 | 0.96 | 0.86 | 0.87 | 0.95 | 0.82 | 0.82 | 0.89 | 0.80 | 0.81 | 0.88 |
| 6 | 0.88 | 0.88 | 0.96 | 0.86 | 0.86 | 0.94 | 0.81 | 0.82 | 0.89 | 0.80 | 0.81 | 0.89 |
| 7 | 0.90 | 0.91 | 0.97 | 0.90 | 0.92 | 0.98 | 0.84 | 0.86 | 0.91 | 0.85 | 0.87 | 0.92 |
| 8 | 0.91 | 0.92 | 0.97 | 0.94 | 0.94 | 0.99 | 0.88 | 0.89 | 0.93 | 0.90 | 0.91 | 0.95 |
| 9 | 0.94 | 0.94 | 0.98 | 0.97 | 0.97 | 1.00 | 0.92 | 0.92 | 0.94 | 0.94 | 0.95 | 0.98 |
| 10 | 0.97 | 0.96 | 0.99 | 1.00 | 0.99 | 1.02 | 0.98 | 0.97 | 0.99 | 1.02 | 1.00 | 1.03 |
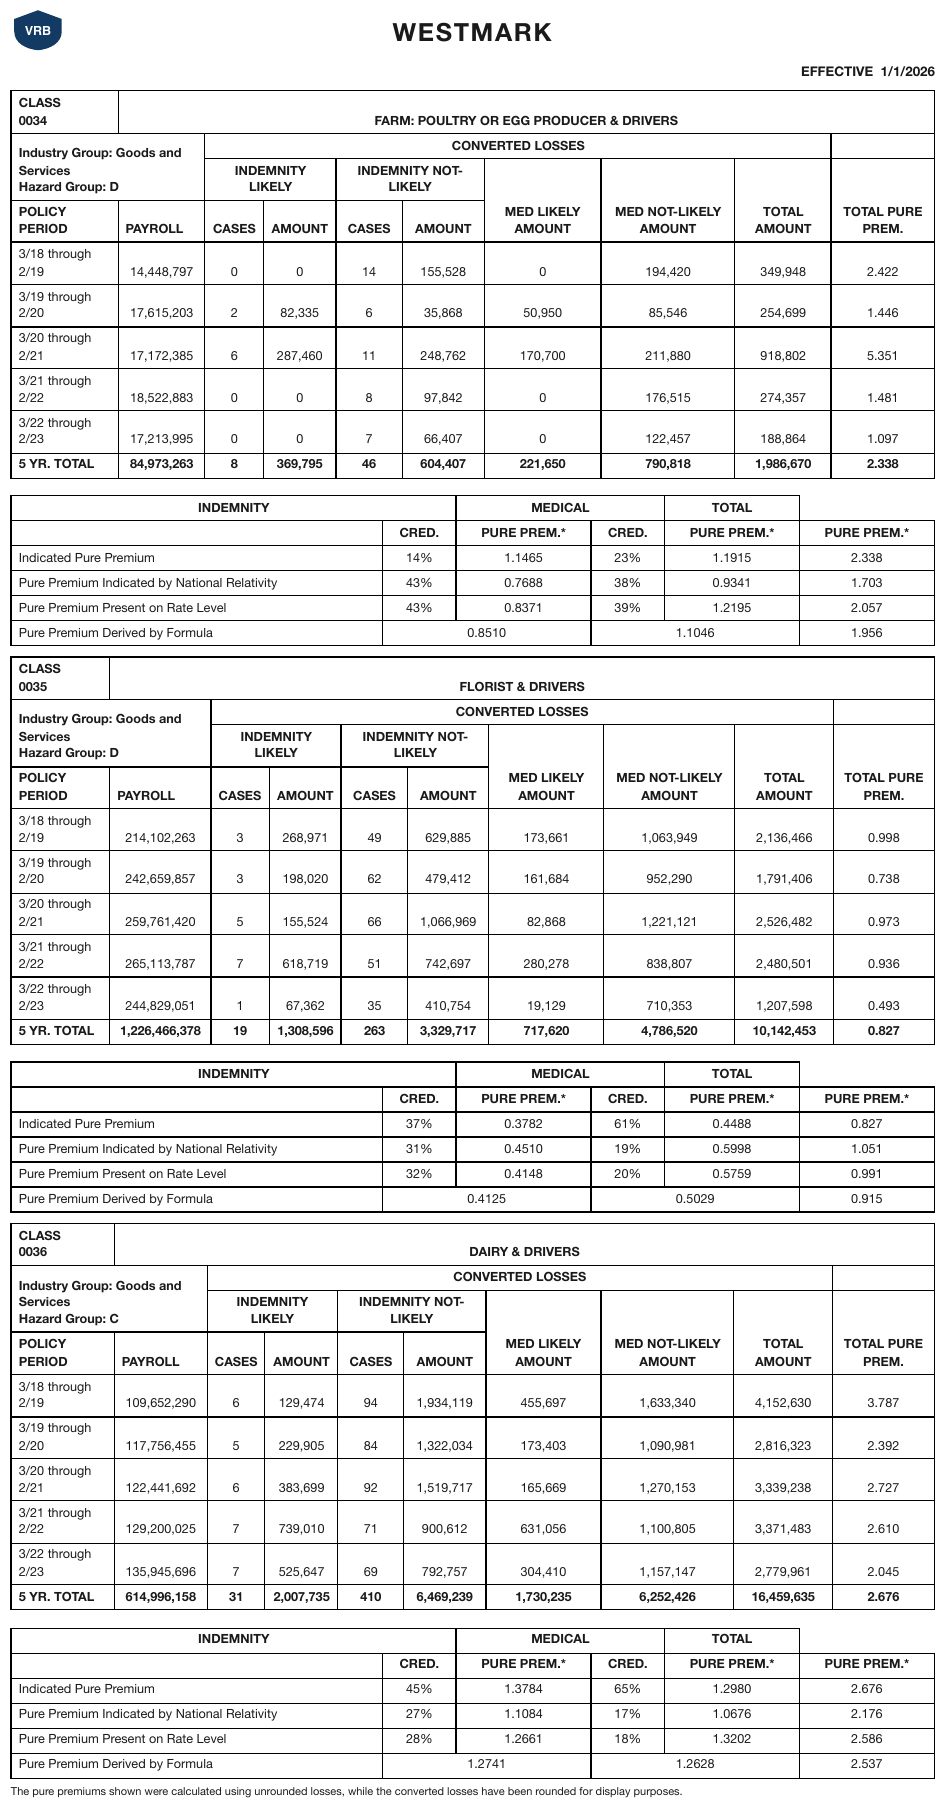
CONVERTED LOSSES band over INDEMNITY LIKELY / NOT-LIKELY sub-bands3tables2
CONVERTED LOSSES band over INDEMNITY LIKELY / NOT-LIKELY sub-bands, with rowspan leaves beneath.
Source page
Expected output · the class 0034 table
| CLASS 0034 | FARM: POULTRY OR EGG PRODUCER & DRIVERS | ||||||||
|---|---|---|---|---|---|---|---|---|---|
| Industry Group: Goods and Services Hazard Group: D | CONVERTED LOSSES | ||||||||
| INDEMNITY LIKELY | INDEMNITY NOT-LIKELY | MED LIKELY AMOUNT | MED NOT-LIKELY AMOUNT | TOTAL AMOUNT | TOTAL PURE PREM. | ||||
| POLICY PERIOD | PAYROLL | CASES | AMOUNT | CASES | AMOUNT | ||||
| 3/18 through 2/19 | 14,448,797 | 0 | 0 | 14 | 155,528 | 0 | 194,420 | 349,948 | 2.422 |
| 3/19 through 2/20 | 17,615,203 | 2 | 82,335 | 6 | 35,868 | 50,950 | 85,546 | 254,699 | 1.446 |
| 3/20 through 2/21 | 17,172,385 | 6 | 287,460 | 11 | 248,762 | 170,700 | 211,880 | 918,802 | 5.351 |
| 3/21 through 2/22 | 18,522,883 | 0 | 0 | 8 | 97,842 | 0 | 176,515 | 274,357 | 1.481 |
| 3/22 through 2/23 | 17,213,995 | 0 | 0 | 7 | 66,407 | 0 | 122,457 | 188,864 | 1.097 |
| 5 YR. TOTAL | 84,973,263 | 8 | 369,795 | 46 | 604,407 | 221,650 | 790,818 | 1,986,670 | 2.338 |
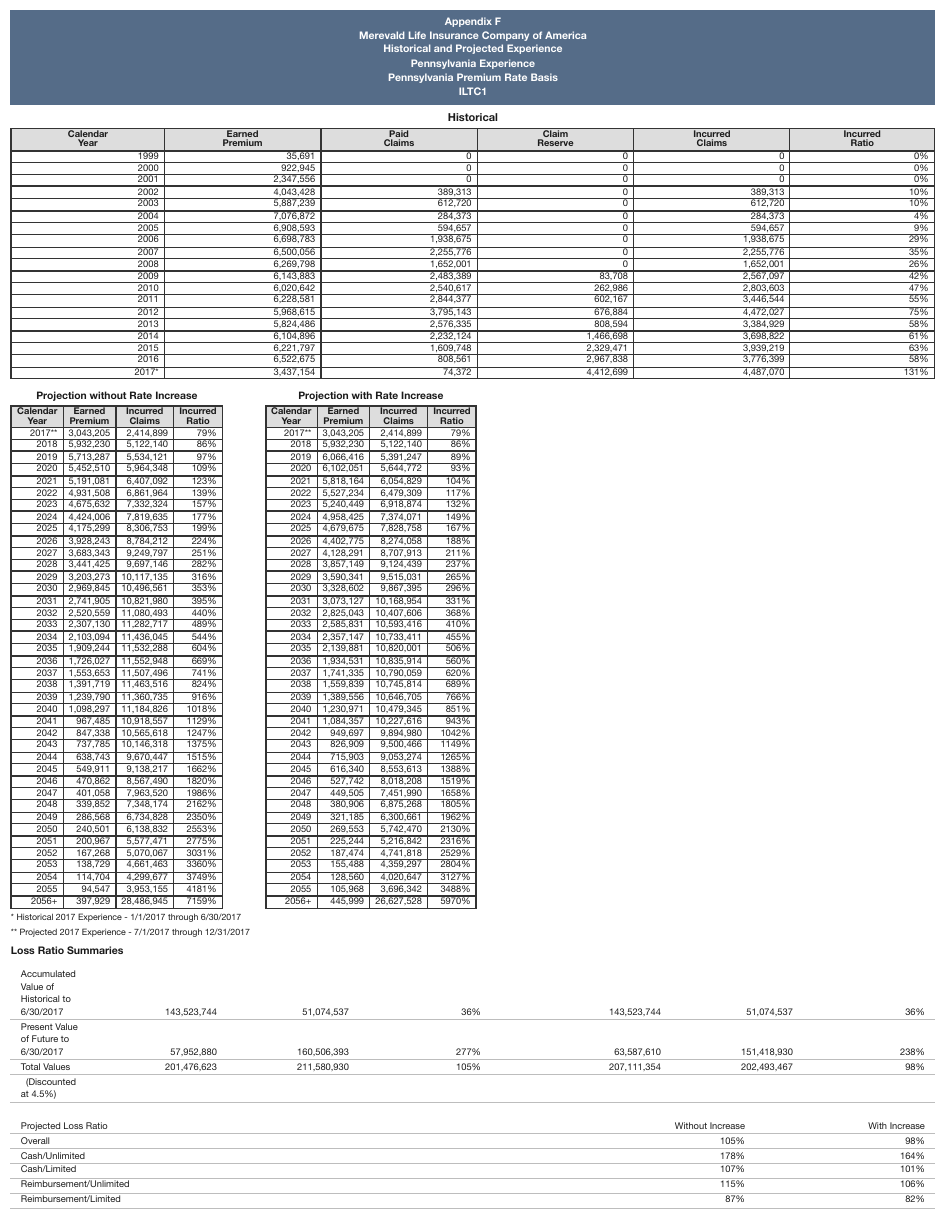
The Loss Ratio Summaries block prints no header row at all3in1
supplying a tier of Premium/Claims/Ratio labels over its columns fabricates headers the page never printed. The block is rendered headerless, and the Projected Loss Ratio block below it keeps its own single header row.
Source page
Expected output · excerpt, the Loss Ratio Summaries
Loss Ratio Summaries
| Accumulated Value of Historical to 6/30/2017 | 143,523,744 | 51,074,537 | 36% | 143,523,744 | 51,074,537 | 36% |
| Present Value of Future to 6/30/2017 | 57,952,880 | 160,506,393 | 277% | 63,587,610 | 151,418,930 | 238% |
| Total Values | 201,476,623 | 211,580,930 | 105% | 207,111,354 | 202,493,467 | 98% |
| (Discounted at 4.5%) |
| Projected Loss Ratio | Without Increase | With Increase |
|---|---|---|
| Overall | 105% | 98% |
| Cash/Unlimited | 178% | 164% |
| Cash/Limited | 107% | 101% |
| Reimbursement/Unlimited | 115% | 106% |
| Reimbursement/Limited | 87% | 82% |
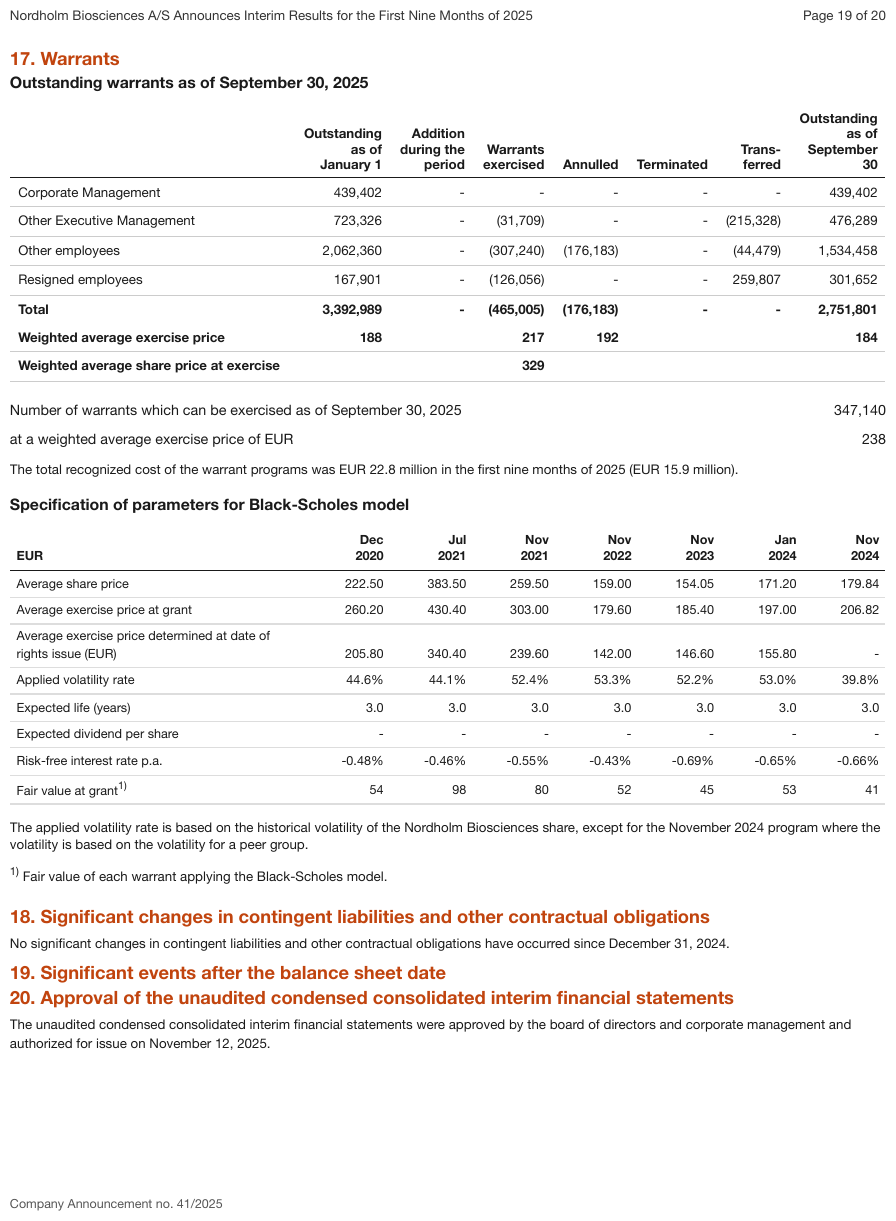
The page prints one header row, each label wrapped over several linesw
Splitting it into a
rowspan="2" tier with an empty second row, as below, invents a tier. Trans- / ferred is one
word broken at a line-end hyphen.
Source page
Expected output · table 1 of 2
| Outstanding as of January 1 | Addition during the period | Warrants exercised | Annulled | Terminated | Transferred | Outstanding as of September 30 | |
|---|---|---|---|---|---|---|---|
| Corporate Management | 439,402 | - | - | - | - | - | 439,402 |
| Other Executive Management | 723,326 | - | (31,709) | - | - | (215,328) | 476,289 |
| Other employees | 2,062,360 | - | (307,240) | (176,183) | - | (44,479) | 1,534,458 |
| Resigned employees | 167,901 | - | (126,056) | - | - | 259,807 | 301,652 |
| Total | 3,392,989 | - | (465,005) | (176,183) | - | - | 2,751,801 |
| Weighted average exercise price | 188 | 217 | 192 | 184 | |||
| Weighted average share price at exercise | 329 |
Non-conforming output
What the rule rules out.
| Outstanding as of January 1 | Addition during the period | Warrants exercised | Annulled | Terminated | Trans- ferred | Outstanding as of September 30 | ||||||||||||||||||||||||||||||||||||||||||||||||||||||||||||||||||||||||||||||||||||||||||||
|---|---|---|---|---|---|---|---|---|---|---|---|---|---|---|---|---|---|---|---|---|---|---|---|---|---|---|---|---|---|---|---|---|---|---|---|---|---|---|---|---|---|---|---|---|---|---|---|---|---|---|---|---|---|---|---|---|---|---|---|---|---|---|---|---|---|---|---|---|---|---|---|---|---|---|---|---|---|---|---|---|---|---|---|---|---|---|---|---|---|---|---|---|---|---|---|---|---|---|
| Corporate Management | 439,402 | - | - | - | - | - | 439,402 | |||||||||||||||||||||||||||||||||||||||||||||||||||||||||||||||||||||||||||||||||||||||||||
| … | ||||||||||||||||||||||||||||||||||||||||||||||||||||||||||||||||||||||||||||||||||||||||||||||||||
The group header stops at the first data column
A group super-header spans its data columns and never the row-label stub. The stub takes a
rowspan across the header rows:
<th rowspan="2">UW Category</th><th colspan="3">Inception to Date</th>
<!-- then: -->  Earned Premium | Incurred Claims | Loss Ratio
The group's colspan MUST equal its leaf count, exactly.
The printed rule under the group starts at the first data column. The stub is not part of "Inception to Date" — the stub says which row, the group says which measure. Different axes, so they do not share a span. Spanning the stub as well is the most common way this goes wrong.
Three genuine tiersstar
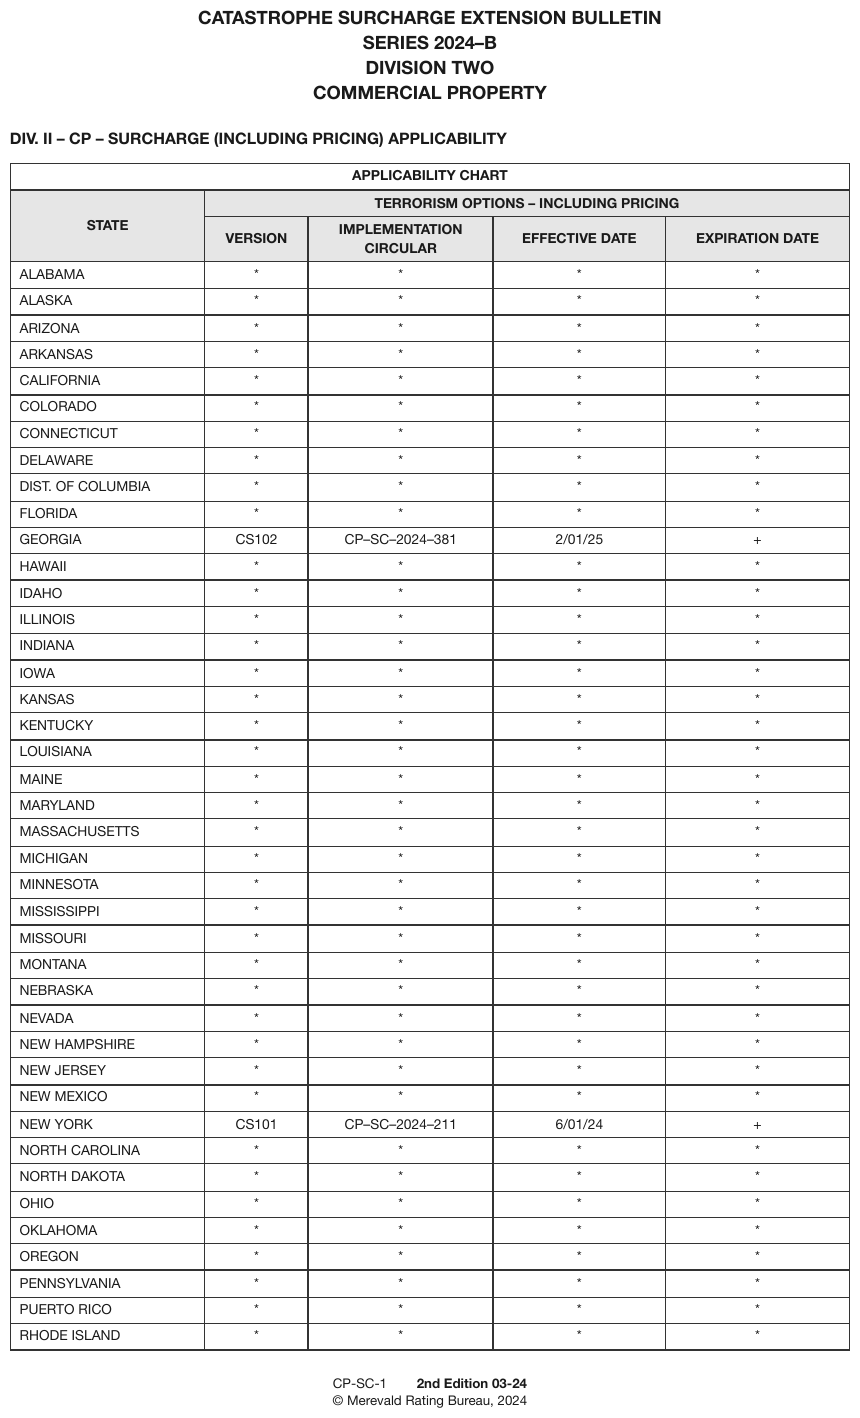
APPLICABILITY CHART (colspan 5) over TERRORISM OPTIONS – INCLUDING PRICING
(colspan 4) over four leaves, with STATE taking rowspan 2 — a clean instance of the stub rule.
The printed asterisks are escaped.Source page
Expected output · excerpt
| APPLICABILITY CHART | ||||||||||||||||||||||||||||||||||||||||||||||||||||||||||||||||||||||||||||||||||||||||||||||||||
|---|---|---|---|---|---|---|---|---|---|---|---|---|---|---|---|---|---|---|---|---|---|---|---|---|---|---|---|---|---|---|---|---|---|---|---|---|---|---|---|---|---|---|---|---|---|---|---|---|---|---|---|---|---|---|---|---|---|---|---|---|---|---|---|---|---|---|---|---|---|---|---|---|---|---|---|---|---|---|---|---|---|---|---|---|---|---|---|---|---|---|---|---|---|---|---|---|---|---|
| STATE | TERRORISM OPTIONS – INCLUDING PRICING | |||||||||||||||||||||||||||||||||||||||||||||||||||||||||||||||||||||||||||||||||||||||||||||||||
| VERSION | IMPLEMENTATION CIRCULAR | EFFECTIVE DATE | EXPIRATION DATE | |||||||||||||||||||||||||||||||||||||||||||||||||||||||||||||||||||||||||||||||||||||||||||||||
| ALABAMA | \* | \* | \* | \* | ||||||||||||||||||||||||||||||||||||||||||||||||||||||||||||||||||||||||||||||||||||||||||||||
| ALASKA | \* | \* | \* | \* | ||||||||||||||||||||||||||||||||||||||||||||||||||||||||||||||||||||||||||||||||||||||||||||||
| ARIZONA | \* | \* | \* | \* | ||||||||||||||||||||||||||||||||||||||||||||||||||||||||||||||||||||||||||||||||||||||||||||||
| ARKANSAS | \* | \* | \* | \* | ||||||||||||||||||||||||||||||||||||||||||||||||||||||||||||||||||||||||||||||||||||||||||||||
| CALIFORNIA | \* | \* | \* | \* | ||||||||||||||||||||||||||||||||||||||||||||||||||||||||||||||||||||||||||||||||||||||||||||||
| COLORADO | \* | \* | \* | \* | ||||||||||||||||||||||||||||||||||||||||||||||||||||||||||||||||||||||||||||||||||||||||||||||
| CONNECTICUT | \* | \* | \* | \* | ||||||||||||||||||||||||||||||||||||||||||||||||||||||||||||||||||||||||||||||||||||||||||||||
| DELAWARE | \* | \* | \* | \* | ||||||||||||||||||||||||||||||||||||||||||||||||||||||||||||||||||||||||||||||||||||||||||||||
| DIST. OF COLUMBIA | \* | \* | \* | \* | ||||||||||||||||||||||||||||||||||||||||||||||||||||||||||||||||||||||||||||||||||||||||||||||
| FLORIDA | \* | \* | \* | \* | ||||||||||||||||||||||||||||||||||||||||||||||||||||||||||||||||||||||||||||||||||||||||||||||
| GEORGIA | CS102 | CP–SC–2024–381 | 2/01/25 | + | ||||||||||||||||||||||||||||||||||||||||||||||||||||||||||||||||||||||||||||||||||||||||||||||
| … | ||||||||||||||||||||||||||||||||||||||||||||||||||||||||||||||||||||||||||||||||||||||||||||||||||
Reconciling the tracks
The leaf-column tracks N of the table are counted. For each header row, the expanded colspans, occupied plus explicit blank tracks, MUST add up to N.
A mismatch shows which kind of error was made, before anything else is inspected:
- a missed column
- a wrong span
- two tables fused into one
- a header line read as the wrong kind of thing
Period stacks in financial statements
| $ in millions |       Average for the        |  ← corner note; apex tier
|               | Three Months Ended | Year …  |
|               | December | December | Dec…   |  ← stacked "December"/"2024"
|               | 2024     | 2023     | 2024   |    is ONE leaf label
Period headers follow the same rules, with a few fixed calls of their own — apex qualifiers, stacked month-over-year labels and the "$ in millions" corner note. They are set out in SEC Period Tiers (§9.3.4), which governs 10-K and 10-Q header stacks.
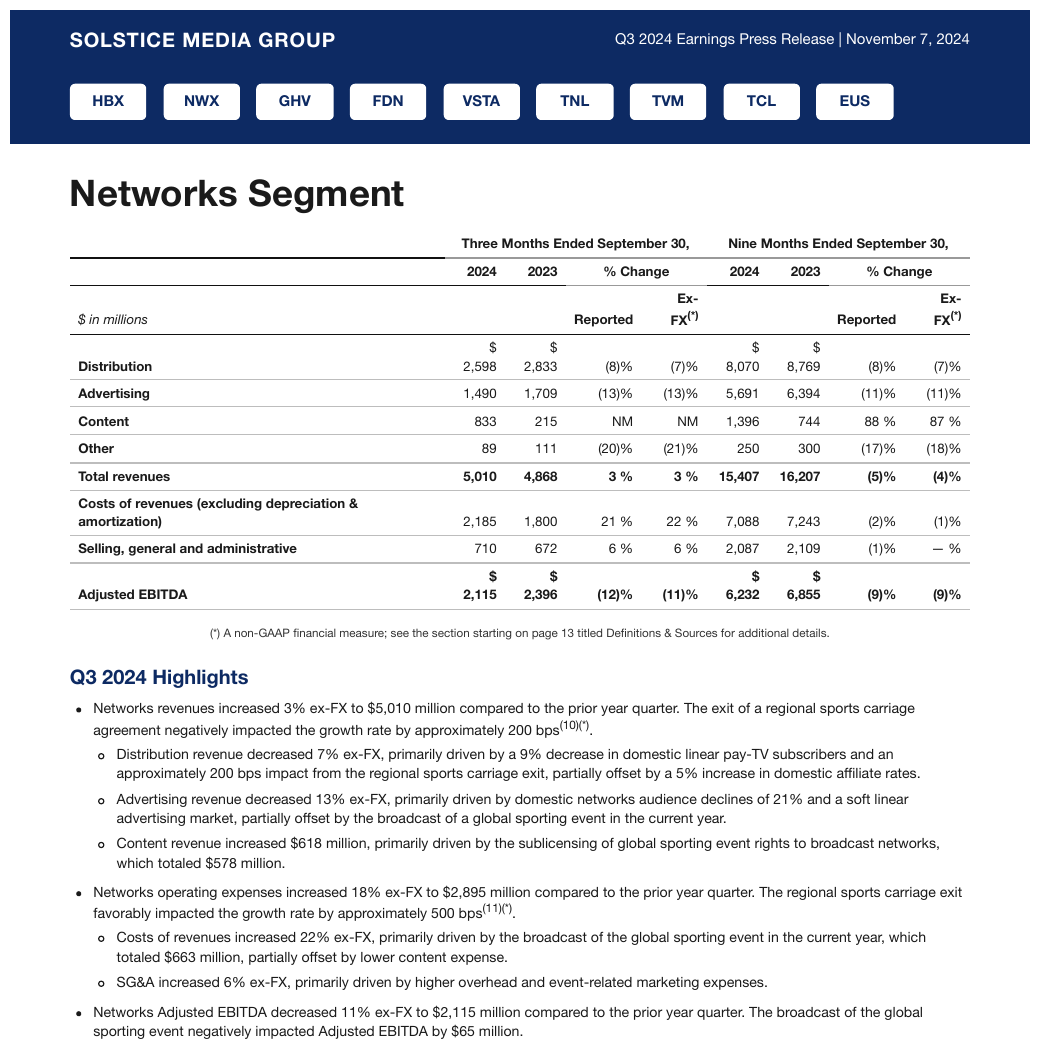
Three Months Ended / Nine Months Ended bands split into year and Reported/Ex-FX…wdb
A rule runs under the year row across the whole table, so the cells under 2024 and 2023 in the
third header row are separate empty cells, not a rowspan. Ex-FX breaks at its own hyphen and
keeps it.
Source page
Expected output
| Three Months Ended September 30, | Nine Months Ended September 30, | |||||||
|---|---|---|---|---|---|---|---|---|
| 2024 | 2023 | % Change | 2024 | 2023 | % Change | |||
| $ in millions | Reported | Ex-FX(\*) | Reported | Ex-FX(\*) | ||||
| Distribution | $ 2,598 | $ 2,833 | (8)% | (7)% | $ 8,070 | $ 8,769 | (8)% | (7)% |
| Advertising | 1,490 | 1,709 | (13)% | (13)% | 5,691 | 6,394 | (11)% | (11)% |
| Content | 833 | 215 | NM | NM | 1,396 | 744 | 88 % | 87 % |
| Other | 89 | 111 | (20)% | (21)% | 250 | 300 | (17)% | (18)% |
| Total revenues | 5,010 | 4,868 | 3 % | 3 % | 15,407 | 16,207 | (5)% | (4)% |
| Costs of revenues (excluding depreciation & amortization) | 2,185 | 1,800 | 21 % | 22 % | 7,088 | 7,243 | (2)% | (1)% |
| Selling, general and administrative | 710 | 672 | 6 % | 6 % | 2,087 | 2,109 | (1)% | — % |
| Adjusted EBITDA | $ 2,115 | $ 2,396 | (12)% | (11)% | $ 6,232 | $ 6,855 | (9)% | (9)% |
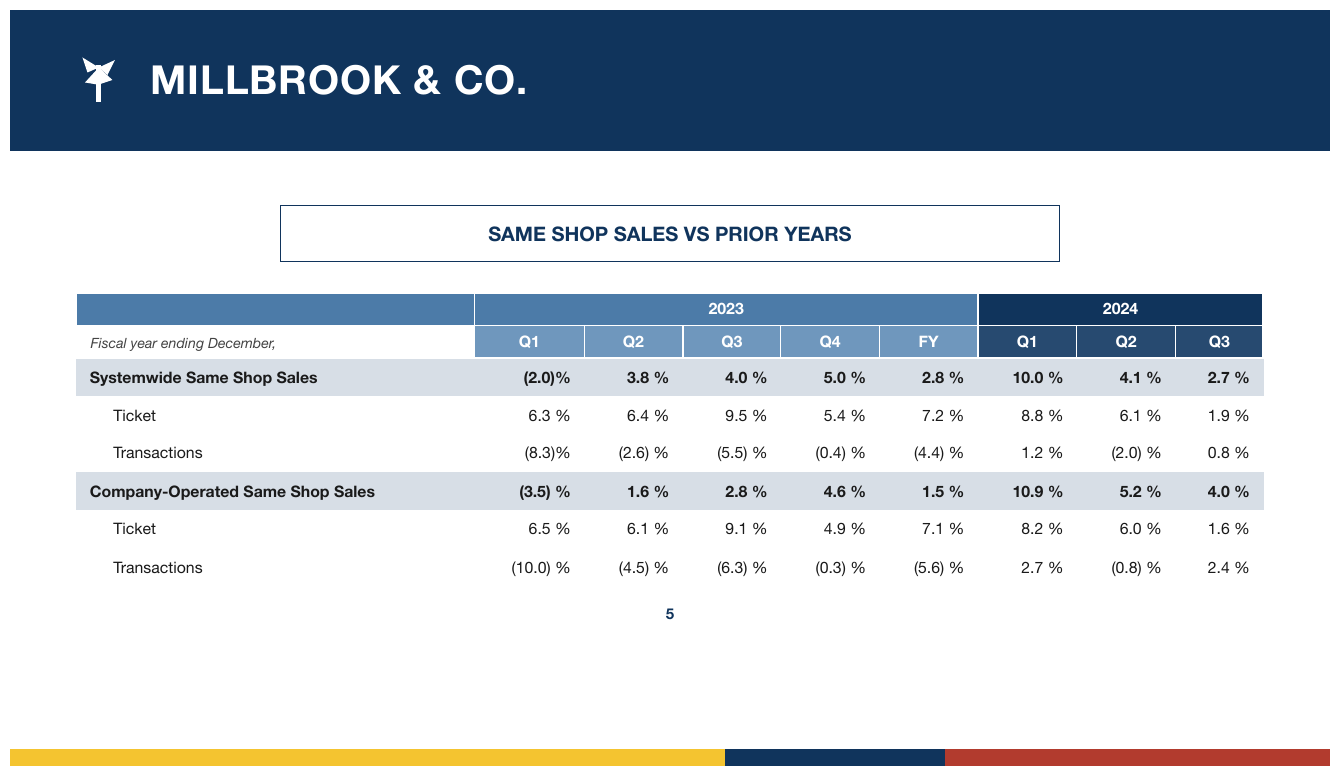
2023 (colspan 5) and 2024 (colspan 3) over Q1–Q4/FY leavessssa
2023 (colspan 5) and 2024 (colspan 3) over Q1–Q4/FY leaves.
Source page
Expected output
| 2023 | 2024 | |||||||
|---|---|---|---|---|---|---|---|---|
| Fiscal year ending December, | Q1 | Q2 | Q3 | Q4 | FY | Q1 | Q2 | Q3 |
| Systemwide Same Shop Sales | (2.0)% | 3.8 % | 4.0 % | 5.0 % | 2.8 % | 10.0 % | 4.1 % | 2.7 % |
| Ticket | 6.3 % | 6.4 % | 9.5 % | 5.4 % | 7.2 % | 8.8 % | 6.1 % | 1.9 % |
| Transactions | (8.3)% | (2.6) % | (5.5) % | (0.4) % | (4.4) % | 1.2 % | (2.0) % | 0.8 % |
| Company-Operated Same Shop Sales | (3.5) % | 1.6 % | 2.8 % | 4.6 % | 1.5 % | 10.9 % | 5.2 % | 4.0 % |
| Ticket | 6.5 % | 6.1 % | 9.1 % | 4.9 % | 7.1 % | 8.2 % | 6.0 % | 1.6 % |
| Transactions | (10.0) % | (4.5) % | (6.3) % | (0.3) % | (5.6) % | 2.7 % | (0.8) % | 2.4 % |
Look-alike
Two similar pages that call for different decisions. Synthetic, for teaching the boundary.
A header label on two lines. One wrapped label, or a parent tier over leaves?
Wrapped label
| Capital in Excess of Par Value | Retained Earnings |
|---|---|
| 12,404 | 98,112 |
| 12,001 | 91,730 |
Join with a space into one header cell.
Real tier
| Common Stock | |
|---|---|
| Shares | Amount |
| 15,943 | $16 |
| 15,908 | $16 |
Keep the tier with its exact colspan.
Look at the structure. What evidence changes the answer?
Neighbouring rules, and how they differ
More
Rule id tables-multi-row-header-tiers · tables headers encoding