Stacked Bars and Waterfalls
A stacked segment—record its own span or the height at its top?
✅ NormativeSettled. The requirement holds as written.📄 Page ruleCan be applied from the page alone.Read §11.2.9 in the RFC ↗
A stacked segment's value MUST be the segment's own span — the size it draws between its two boundaries — never the cumulative height at its top edge. A waterfall step follows the same rule on a floating segment: its value is the rise or fall the step itself draws. Each segment series is a column; a printed total is a value of its own.
When it applies
Writing the running total instead of the segment is the failure this family exists to catch. An estimated segment is read at both boundaries, and its value is the difference.
- A category whose stack has no segment of one series leaves that cell empty.
- A printed total above a stack sits in the stack's row, in a last column under an empty header cell (see the chart table's layout in Cover Every Data Point (§11.1.1)).
- A waterfall's anchor bars (start and end levels) are categories of their own; their values are levels, not changes.
Reading the examples. Each one pairs a source page with the output the rule expects. ✅ Sample: the rule applies. ❌ Counter-sample: it looks like it applies and does not, or a rendering got it wrong. A non-conforming output, in red, is shown only for contrast. … marks content left out of an excerpt.
Examples
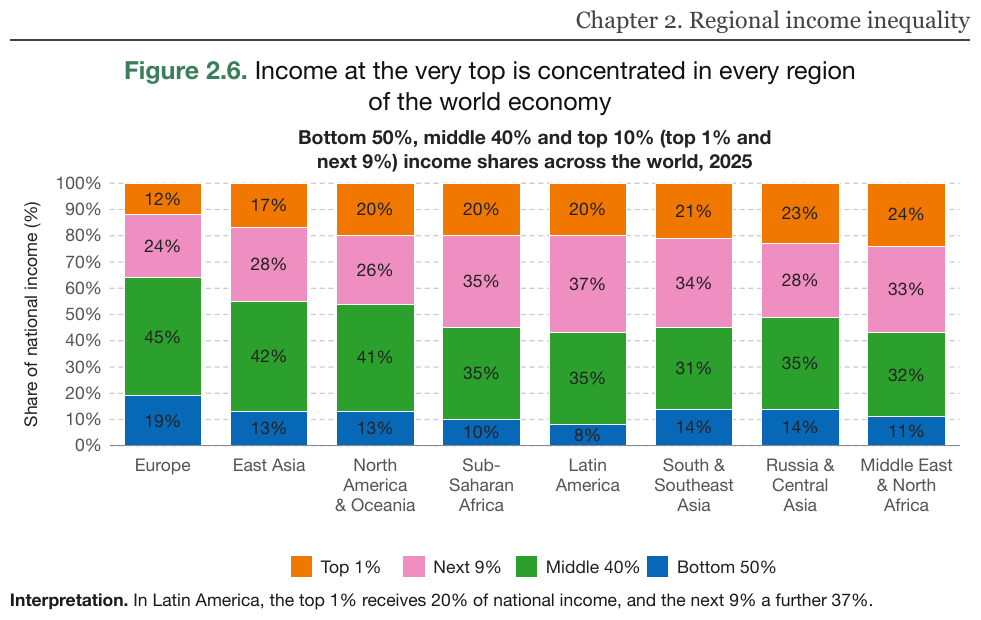
Eight regional stacks, four legend series, every segment printing its shareglobal-income-report-2026_p59
32 values, copied with their percent marks. The running header is elided.
Source page
Expected output
…
| Top 1% | Next 9% | Middle 40% | Bottom 50% | |
|---|---|---|---|---|
| Europe | 12% | 24% | 45% | 19% |
| East Asia | 17% | 28% | 42% | 13% |
| North America & Oceania | 20% | 26% | 41% | 13% |
| Sub-Saharan Africa | 20% | 35% | 35% | 10% |
| Latin America | 20% | 37% | 35% | 8% |
| South & Southeast Asia | 21% | 34% | 31% | 14% |
| Russia & Central Asia | 23% | 28% | 35% | 14% |
| Middle East & North Africa | 24% | 33% | 32% | 11% |
Share of national income (%)
Interpretation. In Latin America, the top 1% receives 20% of national income, and the next 9% a further 37%.
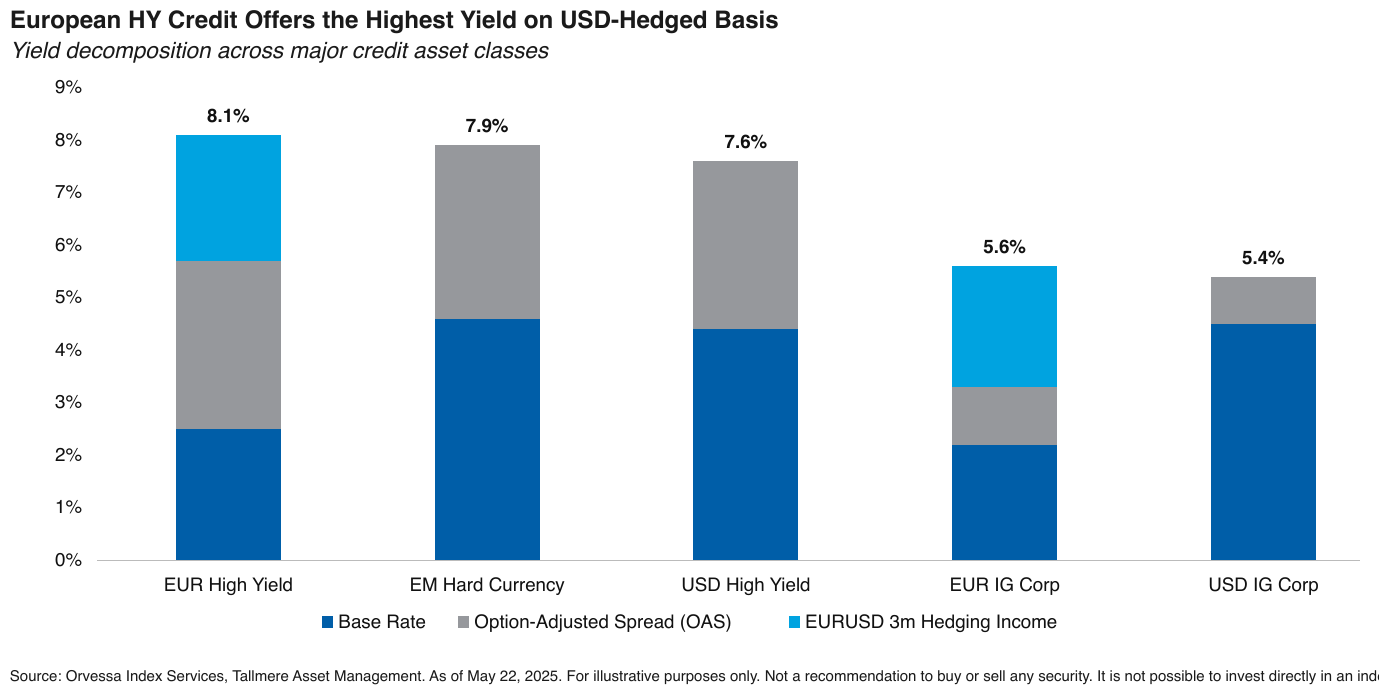
Unlabeled segments over a percent gridcredit-outlook-jun2025_p12
Unlabeled segments over a percent grid, with legend-named components and a printed total above
each stack. Every segment is read as its own span — EUR High Yield's grey segment runs from
about 2.5% to 5.7%, so its value is 3.2%, not 5.7% — and carries the axis's percent mark. Three
of the five classes have no hedging segment: those cells are empty. The printed totals, in bold,
sit in the last column. The source line runs off the right edge of the page and is written as far
as it is visible.
Source page
Expected output
| Base Rate | Option-Adjusted Spread (OAS) | EURUSD 3m Hedging Income | ||
|---|---|---|---|---|
| EUR High Yield | 2.5% | 3.2% | 2.4% | 8.1% |
| EM Hard Currency | 4.6% | 3.3% | 7.9% | |
| USD High Yield | 4.4% | 3.2% | 7.6% | |
| EUR IG Corp | 2.2% | 1.1% | 2.3% | 5.6% |
| USD IG Corp | 4.5% | 0.9% | 5.4% |
Source: Orvessa Index Services, Tallmere Asset Management. As of May 22, 2025. For illustrative purposes only. Not a recommendation to buy or sell any security. It is not possible to invest directly in an ind
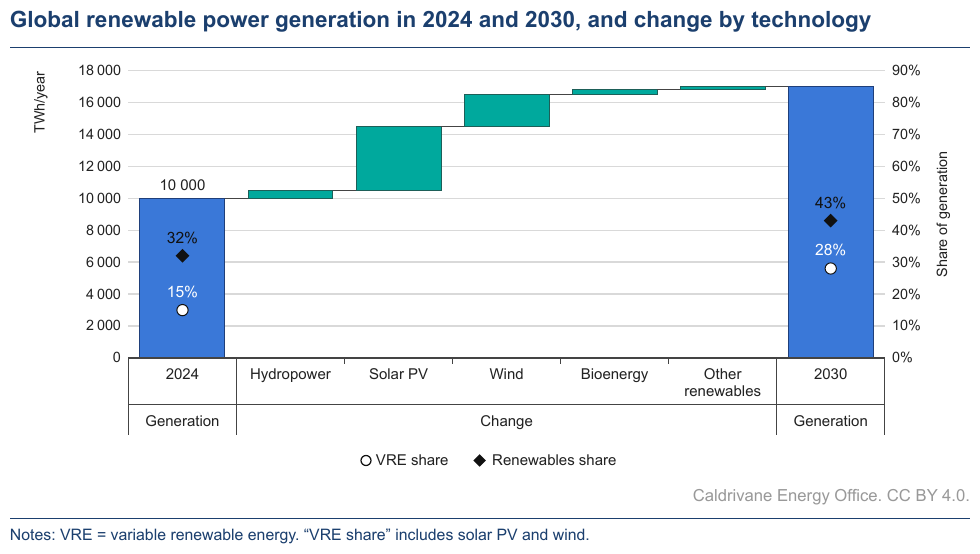
A waterfall between two anchorsrenewables-outlook-2025_p24
2024 prints its level (10 000), 2030 and the five steps are
estimates, each step its own rise. A marker series for each share rides on the anchors against the
right-hand axis, printing its values (see Dual-Axis and Combo Charts (§11.2.2)); the steps have no
markers, so those cells are empty. The printed second axis tier (Generation, Change) groups the
categories and has a column of its own; Change spans the five steps as printed. The bars have no
legend entry, so their column is headed by the left-hand axis title. Estimates are written in the
axis's digit grouping.Source page
Expected output
| TWh/year | VRE share | Renewables share | ||
|---|---|---|---|---|
| Generation | 2024 | 10 000 | 15% | 32% |
| Change | Hydropower | 500 | ||
| Solar PV | 4 000 | |||
| Wind | 2 000 | |||
| Bioenergy | 300 | |||
| Other renewables | 200 | |||
| Generation | 2030 | 17 000 | 28% | 43% |
Share of generation
Caldrivane Energy Office. CC BY 4.0.
Notes: VRE = variable renewable energy. “VRE share” includes solar PV and wind.
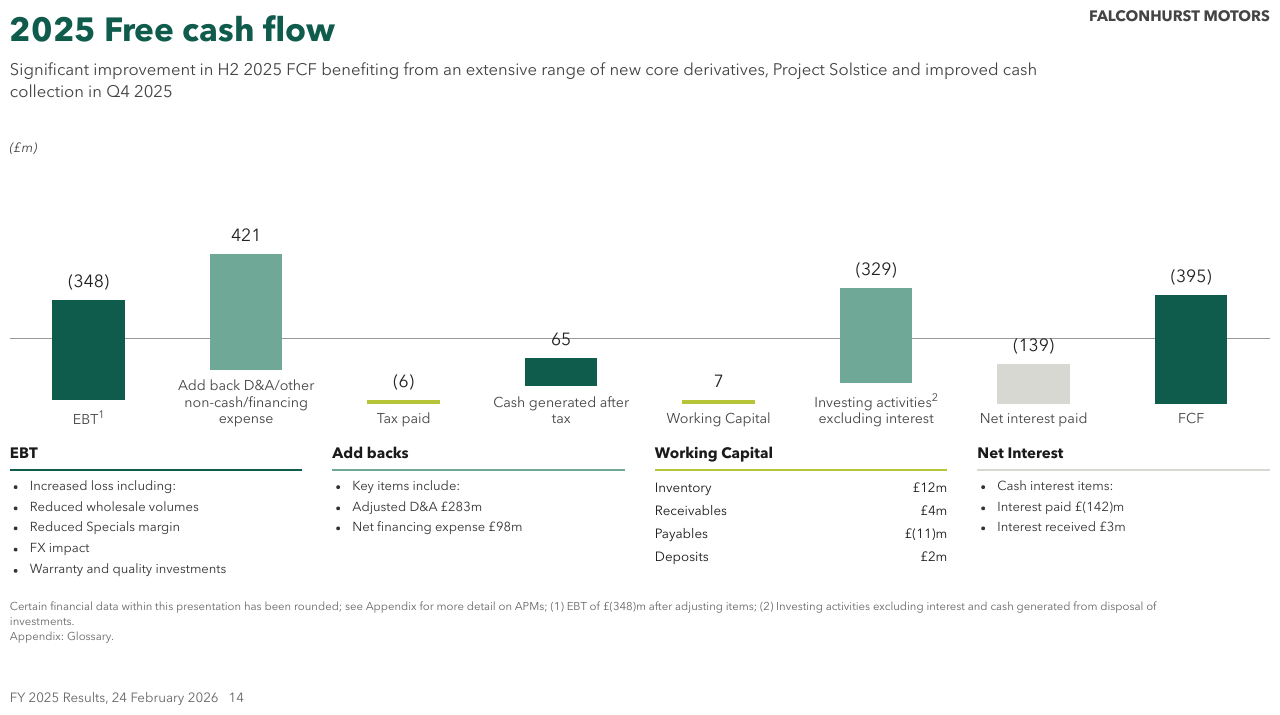
a waterfall where every step prints its value
Eight steps from EBT to FCF, each printing its value above or below its bar, negatives in
parentheses; Tax paid and Working Capital are drawn as a line rather than a bar and print their
values the same way. Every value is copied as printed. The category labels keep their footnote
superscripts, and the unit note heads the value column. The page heading above the chart, and the
panels and notes below it, are elided.
Source page
Expected output · excerpt, the chart
…
| (£m) | |
|---|---|
| EBT1 | (348) |
| Add back D&A/other non-cash/financing expense | 421 |
| Tax paid | (6) |
| Cash generated after tax | 65 |
| Working Capital | 7 |
| Investing activities2 excluding interest | (329) |
| Net interest paid | (139) |
| FCF | (395) |
…
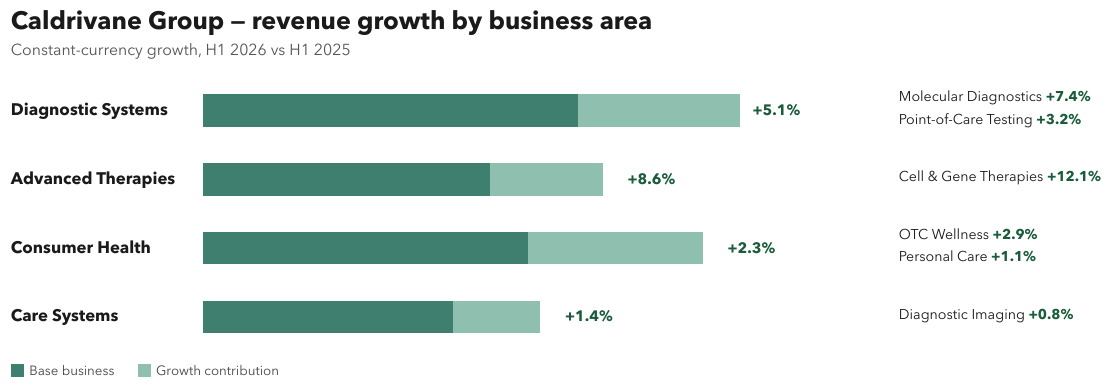
stacked bars with an annotation column
Four horizontal stacks, one per business area, each printing a growth figure at its end and, in a column to the right, one or two lines naming sub-businesses with their own growth. This is one table, one row per bar, with a column holding each row's annotation lines as a list, so the annotations stay attached to their bar. The two segments of each stack print no value and no axis calibrates them, so they give no column; their legend follows the table as text. The labels and growth figures in heavier type are bold.
Source page
Expected output
| Diagnostic Systems | +5.1% |
|
| Advanced Therapies | +8.6% |
|
| Consumer Health | +2.3% |
|
| Care Systems | +1.4% |
|
Base business
Growth contribution
Neighbouring rules, and how they differ
More
Rule id charts-stacked-bars-and-waterfalls · charts types