Group and Cohort Bands
Bands over stacked grids—one table or one per band?
✅ NormativeSettled. The requirement holds as written.📄 Page ruleCan be applied from the page alone.Read §9.2.5 in the RFC ↗
Bands over stacked grids resolve on one question: is there a shared row spine? Grids sharing one spine MUST be rendered as one table. Grids with no shared spine and no column headers MUST be rendered as one table per band, with the band as that table's header row.
When it applies
| Shared spine | No shared spine | |
|---|---|---|
| Row spine | one continuous spine, shared label column | repeated, independent per band |
| Column headers | present, often with a numbered tier | absent entirely |
| Rendering | one table | one table per cohort, band becomes its header row |
The row spine is checked first, then the column headers. Those two signals decide it; the bands themselves look identical in both cases.
Reading the examples. Each one pairs a source page with the output the rule expects. ✅ Sample: the rule applies. ❌ Counter-sample: it looks like it applies and does not, or a rendering got it wrong. A non-conforming output, in red, is shown only for contrast. … marks content left out of an excerpt.
Group bands over a shared spine — one table
Two boxed group headers sitting over one continuous row grid that shares a left label column MUST be rendered as a single table.
|        | Loss of Income | Other         |  ← two boxed bands
| (1)    | (2)   | (3)    | (4)   | (5)   |  ← full-width numbered tier
| 2019   | 1,204 | 887    | 310   | 95    |  ← one shared row spine
The decisive signal
A full-width numbered tier is proof of single-table semantics.
If (1)…(13) runs across the whole width, the page is asserting that all those columns describe
one row. Splitting there loses the row identity that spans the groups — the fact that 2019's
Loss-of-Income figures and its Other figures belong to the same year.
- The group bands MUST be rendered as spanning cells over their column ranges.
- The numbered tier MUST be kept as a header row, not dropped as decoration. See Barely-Existing Columns and Headers (§9.3.1) — dropping the numbered tier as noise also destroys the evidence that the table is one table.
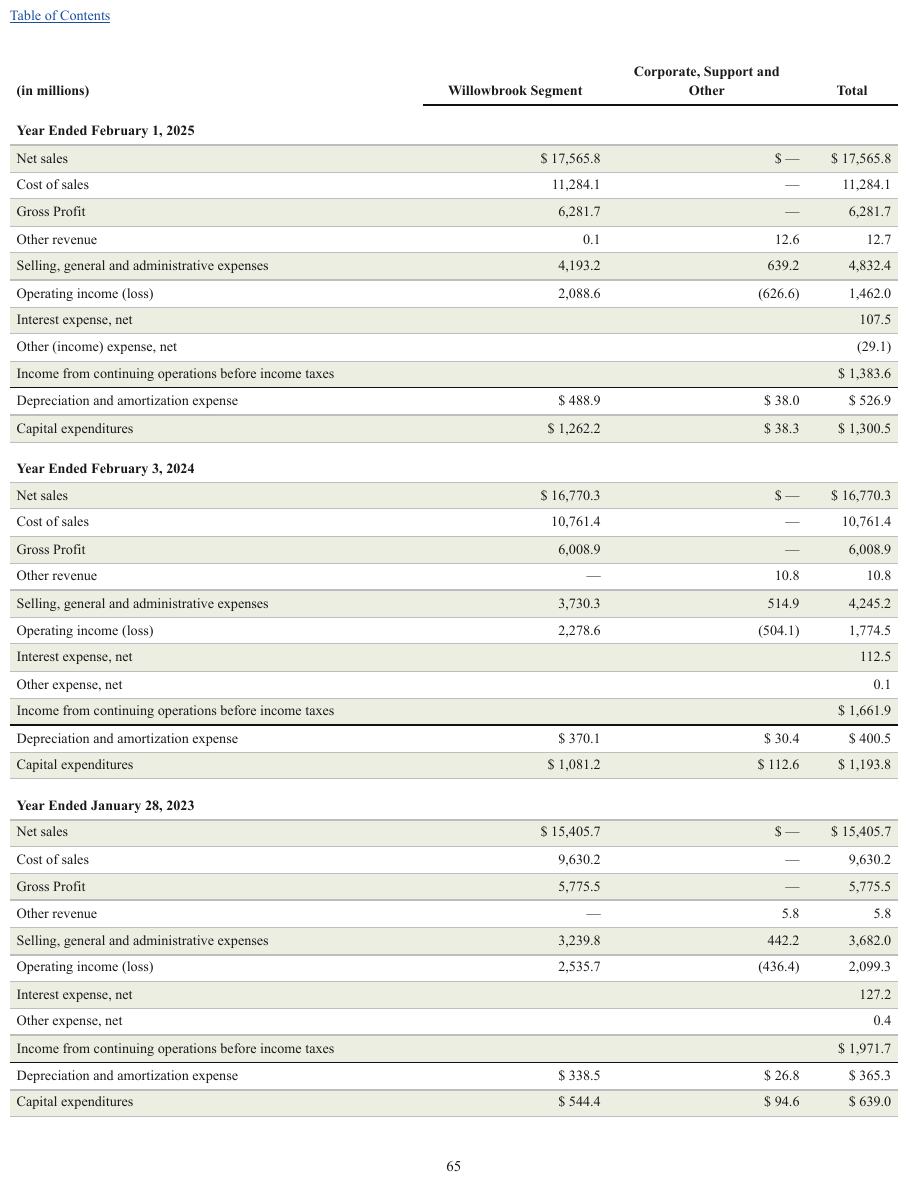
Full-width Year Ended… bands sharing one header and column spine across three fiscal…yef
The currency sign is printed with a space before the figure, and that space is kept.
Source page
Expected output · excerpt
| (in millions) | Willowbrook Segment | Corporate, Support and Other | Total | |||||||||||||||||||||||||||||||||||||||||||||||||||||||||||||||||||||||||||||||||||||||||||||||
|---|---|---|---|---|---|---|---|---|---|---|---|---|---|---|---|---|---|---|---|---|---|---|---|---|---|---|---|---|---|---|---|---|---|---|---|---|---|---|---|---|---|---|---|---|---|---|---|---|---|---|---|---|---|---|---|---|---|---|---|---|---|---|---|---|---|---|---|---|---|---|---|---|---|---|---|---|---|---|---|---|---|---|---|---|---|---|---|---|---|---|---|---|---|---|---|---|---|---|
| Year Ended February 1, 2025 | ||||||||||||||||||||||||||||||||||||||||||||||||||||||||||||||||||||||||||||||||||||||||||||||||||
| Net sales | $ 17,565.8 | $ — | $ 17,565.8 | |||||||||||||||||||||||||||||||||||||||||||||||||||||||||||||||||||||||||||||||||||||||||||||||
| Cost of sales | 11,284.1 | — | 11,284.1 | |||||||||||||||||||||||||||||||||||||||||||||||||||||||||||||||||||||||||||||||||||||||||||||||
| Gross Profit | 6,281.7 | — | 6,281.7 | |||||||||||||||||||||||||||||||||||||||||||||||||||||||||||||||||||||||||||||||||||||||||||||||
| Other revenue | 0.1 | 12.6 | 12.7 | |||||||||||||||||||||||||||||||||||||||||||||||||||||||||||||||||||||||||||||||||||||||||||||||
| Selling, general and administrative expenses | 4,193.2 | 639.2 | 4,832.4 | |||||||||||||||||||||||||||||||||||||||||||||||||||||||||||||||||||||||||||||||||||||||||||||||
| Operating income (loss) | 2,088.6 | (626.6) | 1,462.0 | |||||||||||||||||||||||||||||||||||||||||||||||||||||||||||||||||||||||||||||||||||||||||||||||
| Interest expense, net | 107.5 | |||||||||||||||||||||||||||||||||||||||||||||||||||||||||||||||||||||||||||||||||||||||||||||||||
| Other (income) expense, net | (29.1) | |||||||||||||||||||||||||||||||||||||||||||||||||||||||||||||||||||||||||||||||||||||||||||||||||
| Income from continuing operations before income taxes | $ 1,383.6 | |||||||||||||||||||||||||||||||||||||||||||||||||||||||||||||||||||||||||||||||||||||||||||||||||
| Depreciation and amortization expense | $ 488.9 | $ 38.0 | $ 526.9 | |||||||||||||||||||||||||||||||||||||||||||||||||||||||||||||||||||||||||||||||||||||||||||||||
| Capital expenditures | $ 1,262.2 | $ 38.3 | $ 1,300.5 | |||||||||||||||||||||||||||||||||||||||||||||||||||||||||||||||||||||||||||||||||||||||||||||||
| Year Ended February 3, 2024 | ||||||||||||||||||||||||||||||||||||||||||||||||||||||||||||||||||||||||||||||||||||||||||||||||||
| Net sales | $ 16,770.3 | $ — | $ 16,770.3 | |||||||||||||||||||||||||||||||||||||||||||||||||||||||||||||||||||||||||||||||||||||||||||||||
| … | ||||||||||||||||||||||||||||||||||||||||||||||||||||||||||||||||||||||||||||||||||||||||||||||||||
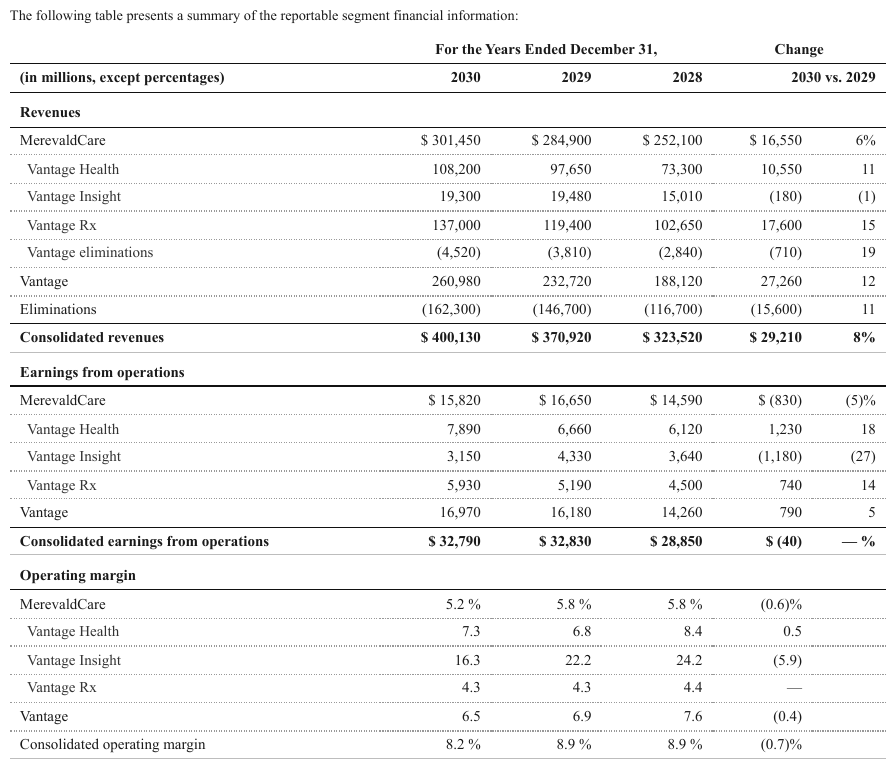
Revenues10k1
Revenues, Earnings from operations, Operating margin bands over one shared segment spine — MerevaldCare, Vantage Health, Vantage Insight, Vantage Rx. The three Vantage lines and the eliminations line under MerevaldCare are indented one step; the consolidated rows are bold totals.
Source page
Expected output · excerpt
| For the Years Ended December 31, | Change | |||||||||||||||||||||||||||||||||||||||||||||||||||||||||||||||||||||||||||||||||||||||||||||||||
|---|---|---|---|---|---|---|---|---|---|---|---|---|---|---|---|---|---|---|---|---|---|---|---|---|---|---|---|---|---|---|---|---|---|---|---|---|---|---|---|---|---|---|---|---|---|---|---|---|---|---|---|---|---|---|---|---|---|---|---|---|---|---|---|---|---|---|---|---|---|---|---|---|---|---|---|---|---|---|---|---|---|---|---|---|---|---|---|---|---|---|---|---|---|---|---|---|---|---|
| (in millions, except percentages) | 2030 | 2029 | 2028 | 2030 vs. 2029 | ||||||||||||||||||||||||||||||||||||||||||||||||||||||||||||||||||||||||||||||||||||||||||||||
| Revenues | ||||||||||||||||||||||||||||||||||||||||||||||||||||||||||||||||||||||||||||||||||||||||||||||||||
| MerevaldCare | $ 301,450 | $ 284,900 | $ 252,100 | $ 16,550 | 6% | |||||||||||||||||||||||||||||||||||||||||||||||||||||||||||||||||||||||||||||||||||||||||||||
| Vantage Health | 108,200 | 97,650 | 73,300 | 10,550 | 11 | |||||||||||||||||||||||||||||||||||||||||||||||||||||||||||||||||||||||||||||||||||||||||||||
| Vantage Insight | 19,300 | 19,480 | 15,010 | (180) | (1) | |||||||||||||||||||||||||||||||||||||||||||||||||||||||||||||||||||||||||||||||||||||||||||||
| Vantage Rx | 137,000 | 119,400 | 102,650 | 17,600 | 15 | |||||||||||||||||||||||||||||||||||||||||||||||||||||||||||||||||||||||||||||||||||||||||||||
| Vantage eliminations | (4,520) | (3,810) | (2,840) | (710) | 19 | |||||||||||||||||||||||||||||||||||||||||||||||||||||||||||||||||||||||||||||||||||||||||||||
| Vantage | 260,980 | 232,720 | 188,120 | 27,260 | 12 | |||||||||||||||||||||||||||||||||||||||||||||||||||||||||||||||||||||||||||||||||||||||||||||
| Eliminations | (162,300) | (146,700) | (116,700) | (15,600) | 11 | |||||||||||||||||||||||||||||||||||||||||||||||||||||||||||||||||||||||||||||||||||||||||||||
| Consolidated revenues | $ 400,130 | $ 370,920 | $ 323,520 | $ 29,210 | 8% | |||||||||||||||||||||||||||||||||||||||||||||||||||||||||||||||||||||||||||||||||||||||||||||
| Earnings from operations | ||||||||||||||||||||||||||||||||||||||||||||||||||||||||||||||||||||||||||||||||||||||||||||||||||
| MerevaldCare | $ 15,820 | $ 16,650 | $ 14,590 | $ (830) | (5)% | |||||||||||||||||||||||||||||||||||||||||||||||||||||||||||||||||||||||||||||||||||||||||||||
| … | ||||||||||||||||||||||||||||||||||||||||||||||||||||||||||||||||||||||||||||||||||||||||||||||||||
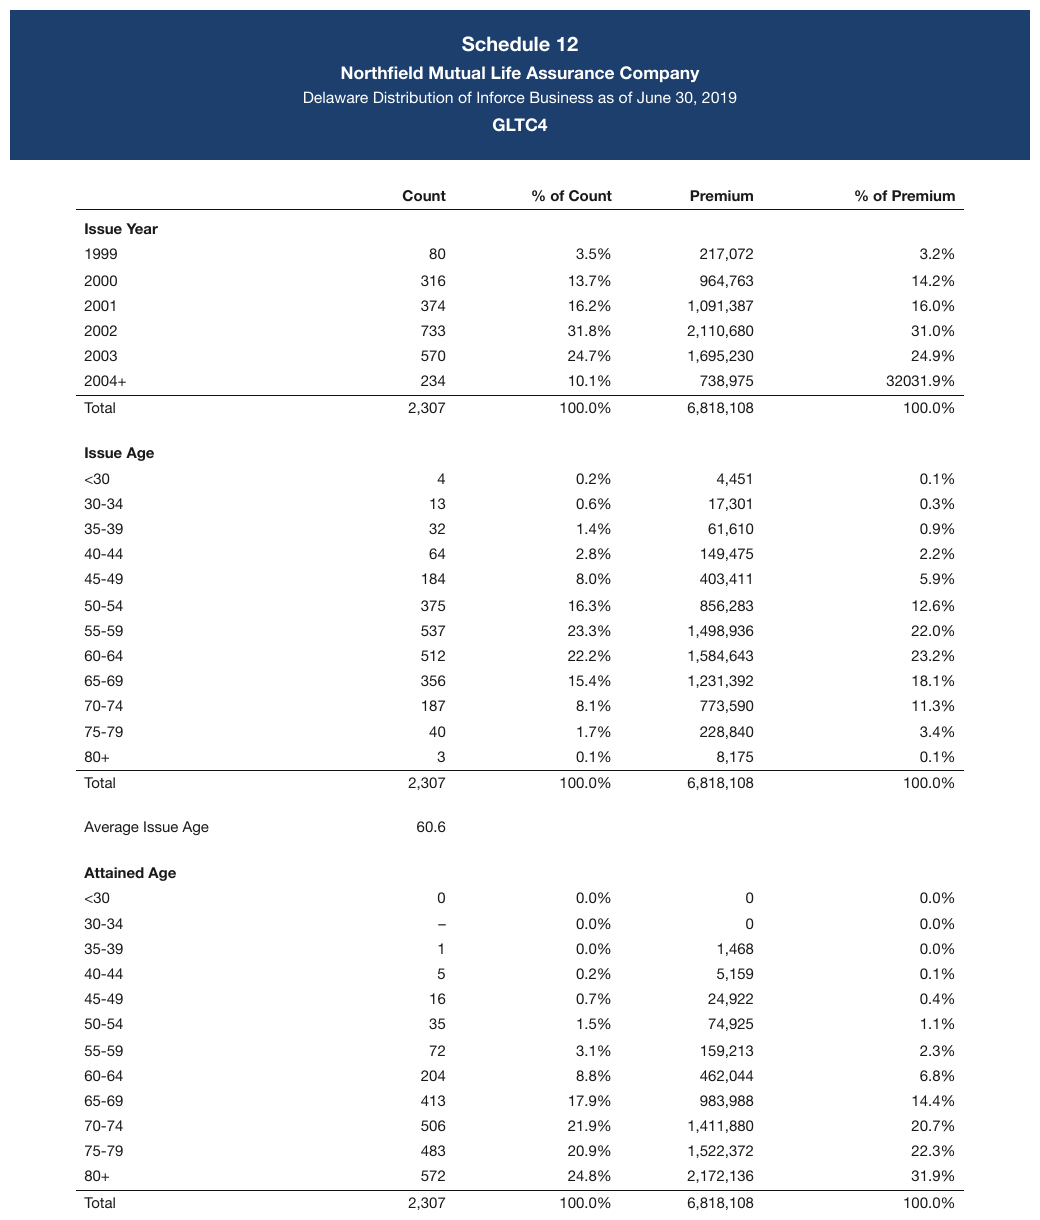
Bold Issue Year / Issue Age / Attained Age bands over one shared column spine3samehead
Bold Issue Year / Issue Age / Attained Age bands over one shared column spine — one table,
three cohorts. Each band is a full-width row. The last Issue Year row prints 32031.9% in the
last column, and that is the value recorded.
Source page
Expected output · excerpt
| Count | % of Count | Premium | % of Premium | |||||||||||||||||||||||||||||||||||||||||||||||||||||||||||||||||||||||||||||||||||||||||||||||
|---|---|---|---|---|---|---|---|---|---|---|---|---|---|---|---|---|---|---|---|---|---|---|---|---|---|---|---|---|---|---|---|---|---|---|---|---|---|---|---|---|---|---|---|---|---|---|---|---|---|---|---|---|---|---|---|---|---|---|---|---|---|---|---|---|---|---|---|---|---|---|---|---|---|---|---|---|---|---|---|---|---|---|---|---|---|---|---|---|---|---|---|---|---|---|---|---|---|---|
| Issue Year | ||||||||||||||||||||||||||||||||||||||||||||||||||||||||||||||||||||||||||||||||||||||||||||||||||
| 1999 | 80 | 3.5% | 217,072 | 3.2% | ||||||||||||||||||||||||||||||||||||||||||||||||||||||||||||||||||||||||||||||||||||||||||||||
| 2000 | 316 | 13.7% | 964,763 | 14.2% | ||||||||||||||||||||||||||||||||||||||||||||||||||||||||||||||||||||||||||||||||||||||||||||||
| 2001 | 374 | 16.2% | 1,091,387 | 16.0% | ||||||||||||||||||||||||||||||||||||||||||||||||||||||||||||||||||||||||||||||||||||||||||||||
| 2002 | 733 | 31.8% | 2,110,680 | 31.0% | ||||||||||||||||||||||||||||||||||||||||||||||||||||||||||||||||||||||||||||||||||||||||||||||
| 2003 | 570 | 24.7% | 1,695,230 | 24.9% | ||||||||||||||||||||||||||||||||||||||||||||||||||||||||||||||||||||||||||||||||||||||||||||||
| 2004+ | 234 | 10.1% | 738,975 | 32031.9% | ||||||||||||||||||||||||||||||||||||||||||||||||||||||||||||||||||||||||||||||||||||||||||||||
| Total | 2,307 | 100.0% | 6,818,108 | 100.0% | ||||||||||||||||||||||||||||||||||||||||||||||||||||||||||||||||||||||||||||||||||||||||||||||
| Issue Age | ||||||||||||||||||||||||||||||||||||||||||||||||||||||||||||||||||||||||||||||||||||||||||||||||||
| <30 | 4 | 0.2% | 4,451 | 0.1% | ||||||||||||||||||||||||||||||||||||||||||||||||||||||||||||||||||||||||||||||||||||||||||||||
| … | ||||||||||||||||||||||||||||||||||||||||||||||||||||||||||||||||||||||||||||||||||||||||||||||||||
Cohort bands with no column headers — one table per cohort
Same-shape grids stacked under cohort bands, with no column headers anywhere:
FEMALE
| 25 | 1.02 | 1.10 |
MALE
| 25 | 1.08 | 1.15 |
One table per cohort. The band becomes that table's header row.
Fusing these into a single table loses the row headers: with the bands demoted to ordinary rows, nothing says which block is female and which is male.
The band is a header here precisely because nothing else is — it is the only thing naming what the rows below it are.
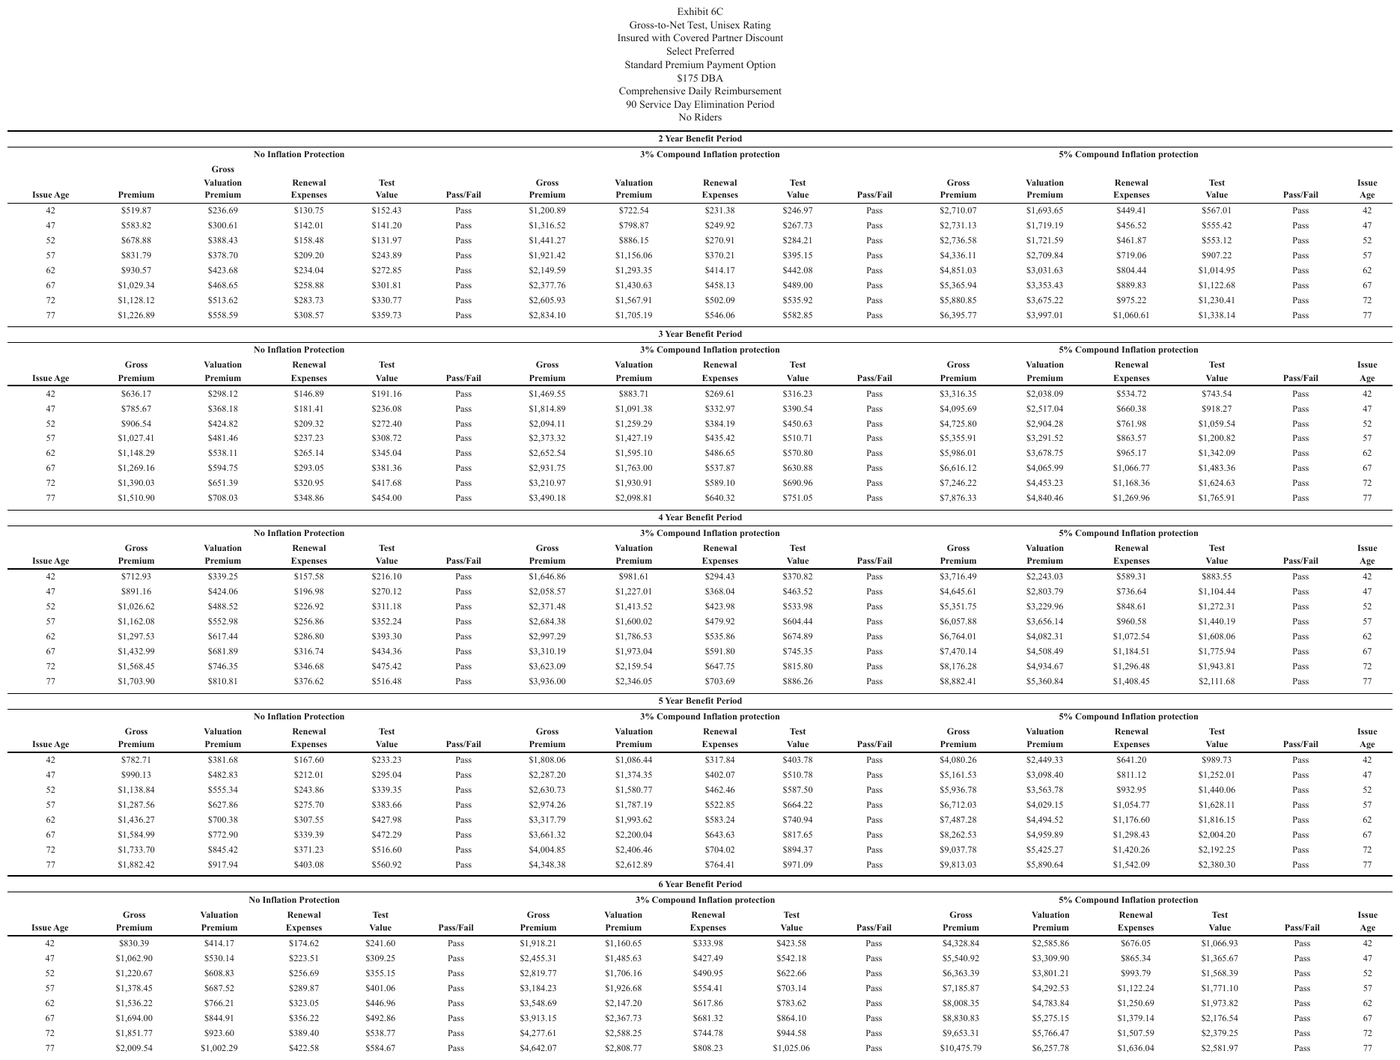
Five title bands (2/3/4/5/6 Year Benefit Period)5t
Five title bands (2/3/4/5/6 Year Benefit Period), each over its own block repeating the same Issue Age spine: five tables, each band as its table's first header row.
Source page
Expected output · excerpt, table 1 of 5
| 2 Year Benefit Period | ||||||||||||||||||||||||||||||||||||||||||||||||||||||||||||||||||||||||||||||||||||||||||||||||||
|---|---|---|---|---|---|---|---|---|---|---|---|---|---|---|---|---|---|---|---|---|---|---|---|---|---|---|---|---|---|---|---|---|---|---|---|---|---|---|---|---|---|---|---|---|---|---|---|---|---|---|---|---|---|---|---|---|---|---|---|---|---|---|---|---|---|---|---|---|---|---|---|---|---|---|---|---|---|---|---|---|---|---|---|---|---|---|---|---|---|---|---|---|---|---|---|---|---|---|
| No Inflation Protection | 3% Compound Inflation protection | 5% Compound Inflation protection | ||||||||||||||||||||||||||||||||||||||||||||||||||||||||||||||||||||||||||||||||||||||||||||||||
| Issue Age | Premium | Gross Valuation Premium | Renewal Expenses | Test Value | Pass/Fail | Gross Premium | Valuation Premium | Renewal Expenses | Test Value | Pass/Fail | Gross Premium | Valuation Premium | Renewal Expenses | Test Value | Pass/Fail | Issue Age | ||||||||||||||||||||||||||||||||||||||||||||||||||||||||||||||||||||||||||||||||||
| 42 | $519.87 | $236.69 | $130.75 | $152.43 | Pass | $1,200.89 | $722.54 | $231.38 | $246.97 | Pass | $2,710.07 | $1,693.65 | $449.41 | $567.01 | Pass | 42 | ||||||||||||||||||||||||||||||||||||||||||||||||||||||||||||||||||||||||||||||||||
| 47 | $583.82 | $300.61 | $142.01 | $141.20 | Pass | $1,316.52 | $798.87 | $249.92 | $267.73 | Pass | $2,731.13 | $1,719.19 | $456.52 | $555.42 | Pass | 47 | ||||||||||||||||||||||||||||||||||||||||||||||||||||||||||||||||||||||||||||||||||
| 52 | $678.88 | $388.43 | $158.48 | $131.97 | Pass | $1,441.27 | $886.15 | $270.91 | $284.21 | Pass | $2,736.58 | $1,721.59 | $461.87 | $553.12 | Pass | 52 | ||||||||||||||||||||||||||||||||||||||||||||||||||||||||||||||||||||||||||||||||||
| … | ||||||||||||||||||||||||||||||||||||||||||||||||||||||||||||||||||||||||||||||||||||||||||||||||||
| 77 | $1,226.89 | $558.59 | $308.57 | $359.73 | Pass | $2,834.10 | $1,705.19 | $546.06 | $582.85 | Pass | $6,395.77 | $3,997.01 | $1,060.61 | $1,338.14 | Pass | 77 | ||||||||||||||||||||||||||||||||||||||||||||||||||||||||||||||||||||||||||||||||||
Each rating class (0034 / 0035 / 0036) is its own titled cohort block, stacked3tables2
the class number and
name form the first header row of each class table, and a separate credibility grid follows each.
CLASS and its number are printed on two lines in a cell wide enough for one, and the industry and
hazard groups are two separate lines.
Source page
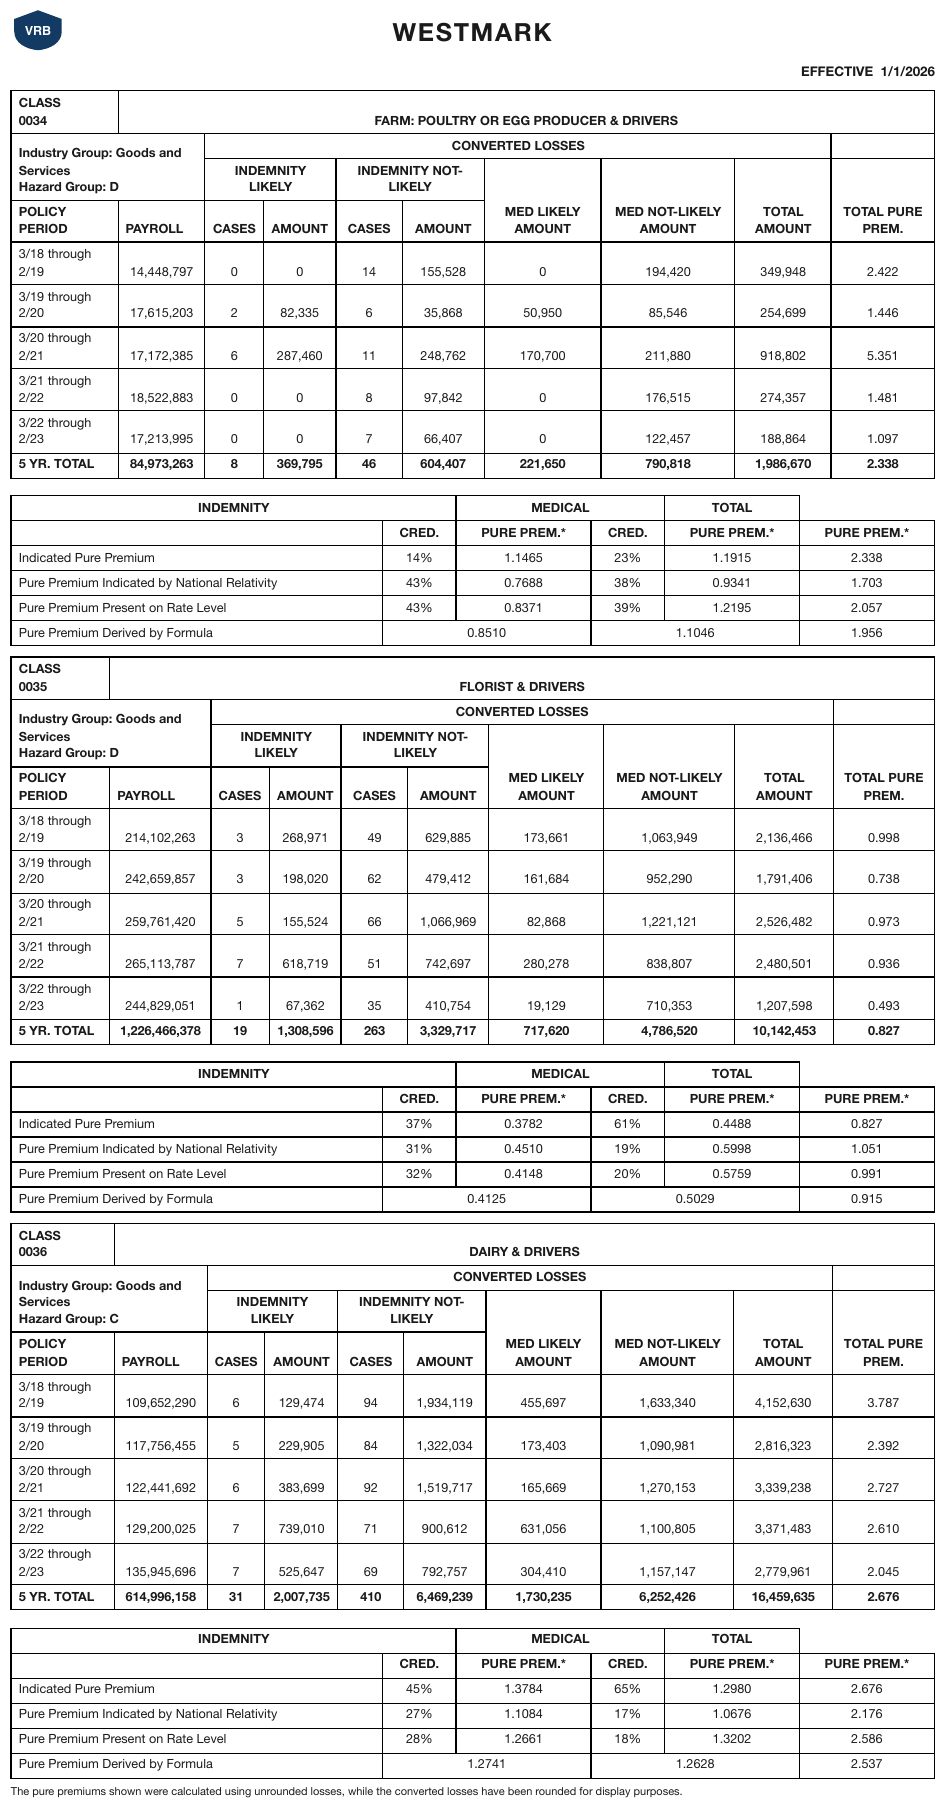
Expected output · excerpt, the class 0034 table
| CLASS 0034 | FARM: POULTRY OR EGG PRODUCER & DRIVERS | ||||||||
|---|---|---|---|---|---|---|---|---|---|
| Industry Group: Goods and Services Hazard Group: D | CONVERTED LOSSES | ||||||||
| INDEMNITY LIKELY | INDEMNITY NOT-LIKELY | MED LIKELY AMOUNT | MED NOT-LIKELY AMOUNT | TOTAL AMOUNT | TOTAL PURE PREM. | ||||
| POLICY PERIOD | PAYROLL | CASES | AMOUNT | CASES | AMOUNT | ||||
| 3/18 through 2/19 | 14,448,797 | 0 | 0 | 14 | 155,528 | 0 | 194,420 | 349,948 | 2.422 |
| 3/19 through 2/20 | 17,615,203 | 2 | 82,335 | 6 | 35,868 | 50,950 | 85,546 | 254,699 | 1.446 |
| 3/20 through 2/21 | 17,172,385 | 6 | 287,460 | 11 | 248,762 | 170,700 | 211,880 | 918,802 | 5.351 |
| 3/21 through 2/22 | 18,522,883 | 0 | 0 | 8 | 97,842 | 0 | 176,515 | 274,357 | 1.481 |
| 3/22 through 2/23 | 17,213,995 | 0 | 0 | 7 | 66,407 | 0 | 122,457 | 188,864 | 1.097 |
| 5 YR. TOTAL | 84,973,263 | 8 | 369,795 | 46 | 604,407 | 221,650 | 790,818 | 1,986,670 | 2.338 |
…
Keeping the two apart
The two shapes look alike from a distance and resolve in opposite directions, so both checks are run deliberately:
- Does the left label column run continuously through both bands, unrepeated? → one table.
- Does each band restart the same labels under it, with no column headers printed anywhere? → one table per band.
Date bands and shading changes inside a single grid are a different question again — see Bands Inside the Grid (§9.2.1).
Look-alike
Two similar pages that call for different decisions. Synthetic, for teaching the boundary.
Same-shaped grids stacked under bands. One table, or one per band?
Shared row spine
| 2024 | 2023 | |
|---|---|---|
| Revenues | ||
| Optum Health | 105,358 | 95,319 |
| Optum Rx | 133,231 | 116,087 |
| Operating margin | ||
| Optum Health | 6.2% | 7.0% |
One table. Bands become spanning rows.
No column headers anywhere
| FEMALE | ||
| 25 | 1.02 | 1.10 |
| 35 | 1.08 | 1.15 |
| MALE | ||
| 25 | 1.08 | 1.15 |
| 35 | 1.14 | 1.22 |
One table per cohort. The band is its header row.
Look at the structure. What evidence changes the answer?
Neighbouring rules, and how they differ
More
Rule id tables-group-and-cohort-bands · tables boundaries headers