Stat Tiles
A grid of big-number tiles—a table or label–value pairs?
✅ NormativeSettled. The requirement holds as written.📄 Page ruleCan be applied from the page alone.Read §5.11 in the RFC ↗
Each stat tile MUST be rendered as one printed label–value pair, in tile reading order, under the panel's heading where the panel prints one. Units and qualifiers MUST stay attached to their value.
When it applies
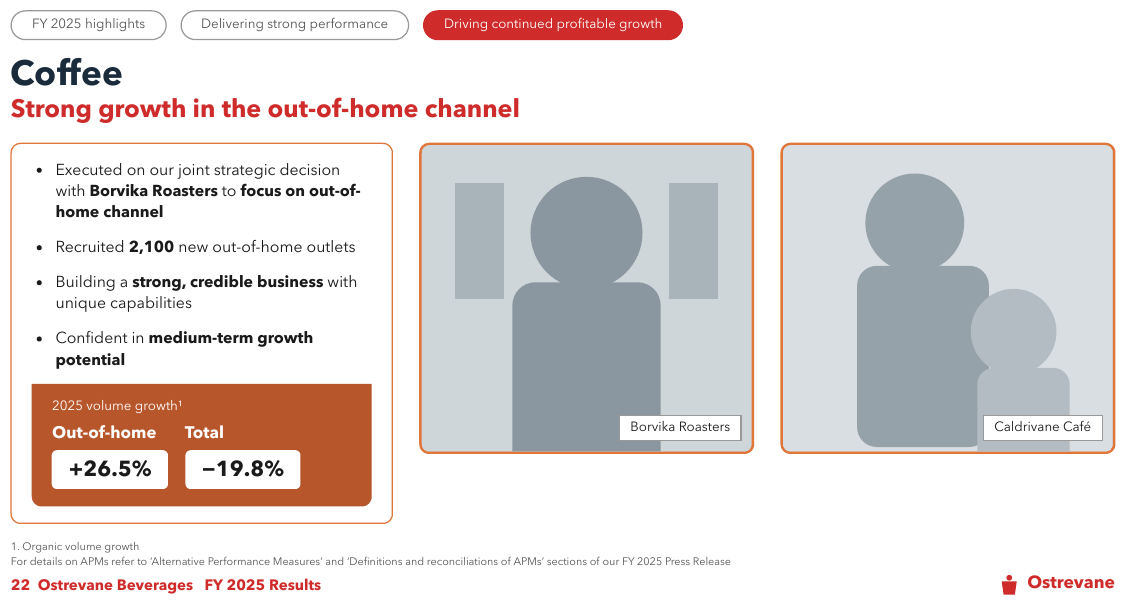
A slide panel that prints a big number with a short label — Out-of-home +26.5%, Total -19.8% —
usually two or three of them side by side under a heading.
┌─ 2025 volume growth¹ ──────────┐
│  Out-of-home        Total       │
│  ┌────────┐       ┌────────┐    │
│  │ +26.5% │       │ -19.8% │    │
└──────────────────────────────────┘
Read top to bottom, the labels come first and the values after, so a geometric reading separates each figure from its label — the failure to avoid.
Reading the examples. Each one pairs a source page with the output the rule expects. ✅ Sample: the rule applies. ❌ Counter-sample: it looks like it applies and does not, or a rendering got it wrong. A non-conforming output, in red, is shown only for contrast. … marks content left out of an excerpt.
Requirements
- Each tile MUST be one key-value line,
- label: value, with the label and the value as printed; bold only where the glyphs are heavier. - The tiles MUST follow tile reading order, each label next to its own value.
- A printed panel heading MUST come before its tiles. A heading MUST NOT be invented where the panel prints none.
- A unit, sign, footnote marker or qualifier (
LFL,(+1.9%)) MUST stay with the value it qualifies; an icon that carries the direction MUST be kept — see Iconography and Symbols (§7.3.4).
a growth panel beside two photos
2025 volume growth¹ over two labelled figures, inside an orange box under four bullets. Each tile
becomes one line, label then value, in left-to-right order. The rest of the slide — tabs, photos,
footer — is rendered in Slide Furniture (§5.10).
Source page
Expected output · excerpt, the stat panel
…
2025 volume growth1
- Out-of-home: +26.5%
- Total: −19.8%
…
<!-- … -->
2025 volume growth<sup>1</sup>
- Out-of-home: +26.5%
- Total: −19.8%
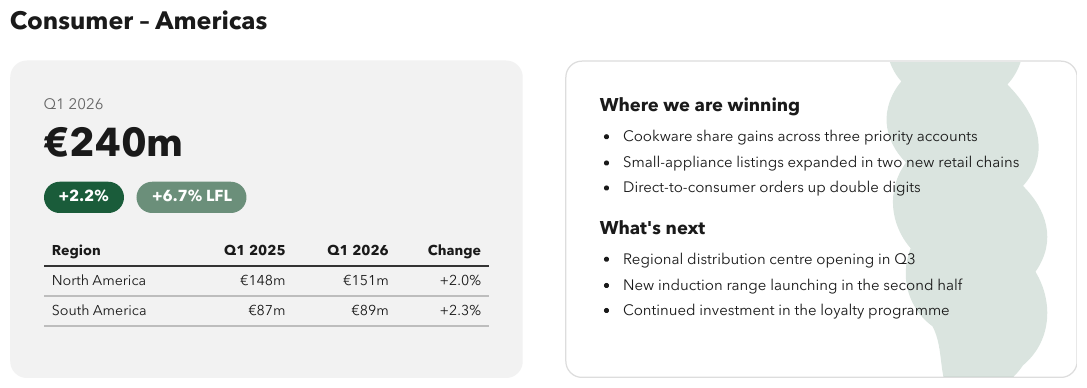
<!-- … -->a headline figure over a small table
Q1 2026 over €240m, with the qualifiers +2.2% and +6.7% LFL in pills beneath, then a
four-column table in the same card. The headline figure is one tile: its label, its value and both
qualifiers on one line. The right-hand card is rendered in Slide Furniture (§5.10).
Source page
Expected output · excerpt, the left card
Consumer – Americas
- Q1 2026: €240m +2.2% +6.7% LFL
| Region | Q1 2025 | Q1 2026 | Change |
|---|---|---|---|
| North America | €148m | €151m | +2.0% |
| South America | €87m | €89m | +2.3% |
…
# Consumer – Americas
- Q1 2026: €240m +2.2% +6.7% LFL
<table>
<tr> <th>Region</th> <th>Q1 2025</th> <th>Q1 2026</th> <th>Change</th> </tr>
<tr> <td>North America</td> <td>€148m</td> <td>€151m</td> <td>+2.0%</td> </tr>
<tr> <td>South America</td> <td>€87m</td> <td>€89m</td> <td>+2.3%</td> </tr>
</table>
<!-- … -->tiles with an arrow icon
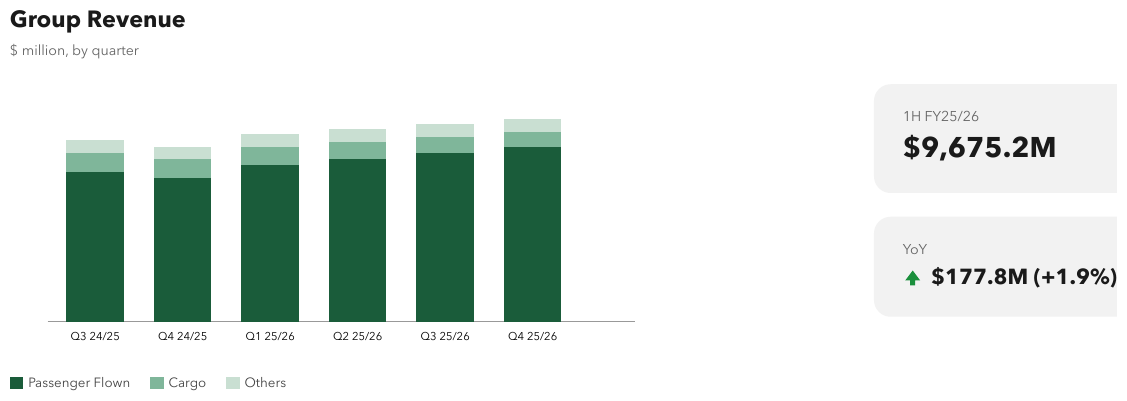
Two rounded tiles beside a stacked-bar chart: 1H FY25/26 over $9,675.2M, then YoY with a
green up-arrow before $177.8M (+1.9%). The arrow carries the direction and is kept as a bracketed
tag. The chart prints no value axis and no values; its rendering follows the Charts chapter and is
elided here.
Source page
Expected output
Group Revenue
$ million, by quarter
…
- 1H FY25/26: $9,675.2M
- YoY: [up] $177.8M (+1.9%)
# Group Revenue
$ million, by quarter
<!-- … -->
- 1H FY25/26: $9,675.2M
- YoY: [up] $177.8M (+1.9%)
Neighbouring rules, and how they differ
More
Rule id layout-stat-tiles · rule layout slides