Bars and Histograms
One bar, one rule—but what is a histogram's category?
✅ NormativeSettled. The requirement holds as written.📄 Page ruleCan be applied from the page alone.Read §11.2.1 in the RFC ↗
A bar chart MUST be rendered as a chart table with one value per bar: one row per category, one
column per series. A histogram is a bar chart whose category is the bin: a bin the axis does not
label MUST still get its row, labeled by its axis value, and a labeled position with no bar
MUST hold 0.
When it applies
- A single series gives a two-column table — see the full example in Values and Tolerances (§11.1.4).
- Grouped bars give one column per legend series — see the full example in Labels (§11.1.2).
- Horizontal bars change nothing: the category axis simply runs vertically, and rows follow it top to bottom.
- A highlighted or average bar (
EU average, shaded behind the rest) is an ordinary row. An average line is reference ink and adds nothing to the table (see Multiple Charts and Reference Ink (§11.1.3)).
Reading the examples. Each one pairs a source page with the output the rule expects. ✅ Sample: the rule applies. ❌ Counter-sample: it looks like it applies and does not, or a rendering got it wrong. A non-conforming output, in red, is shown only for contrast. … marks content left out of an excerpt.
Histogram bins
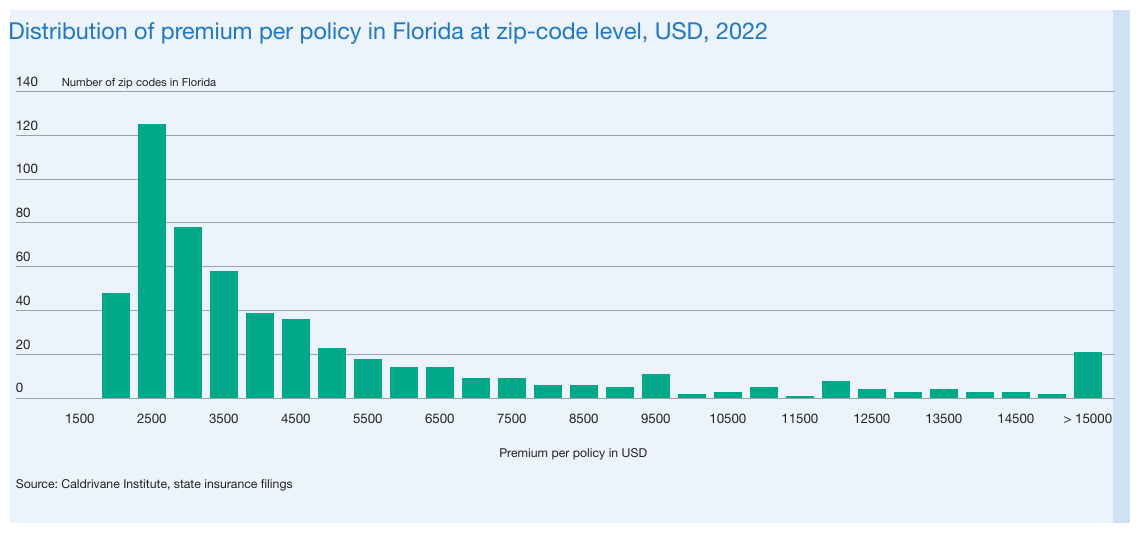
Printed bin labels are copied verbatim, catch-alls included (> 15000). When the axis labels only
every other bin, the unlabeled bins still exist: each gets a row labeled by its axis value — 2000
between the ticks 1500 and 2500 on an axis labeled every $1 000. A bin that no printed
calibration reaches is not locatable (see Cover Every Data Point (§11.1.1)).
Bins every $500catastrophe-review-2025_p4
Bins every $500, labels every $1 000, a printed catch-all, and one labeled position (1500) with no
bar. Full coverage is 29 rows: 1500 holds 0; the unlabeled bins are labeled by their axis values
(2000, 3000 …); every count is an estimate against the 20-unit grid. The catch-all keeps its
printed space (> 15000). The value axis title heads the single value column; the category axis
title heads the label column.
Source page
Expected output
| Premium per policy in USD | Number of zip codes in Florida |
|---|---|
| 1500 | 0 |
| 2000 | 48 |
| 2500 | 125 |
| 3000 | 78 |
| 3500 | 58 |
| 4000 | 39 |
| 4500 | 36 |
| 5000 | 23 |
| 5500 | 18 |
| 6000 | 14 |
| 6500 | 14 |
| 7000 | 9 |
| 7500 | 9 |
| 8000 | 6 |
| 8500 | 6 |
| 9000 | 5 |
| 9500 | 11 |
| 10000 | 2 |
| 10500 | 3 |
| 11000 | 5 |
| 11500 | 1 |
| 12000 | 8 |
| 12500 | 4 |
| 13000 | 3 |
| 13500 | 4 |
| 14000 | 3 |
| 14500 | 3 |
| 15000 | 2 |
| > 15000 | 21 |
Source: Caldrivane Institute, state insurance filings
Progress and target bars
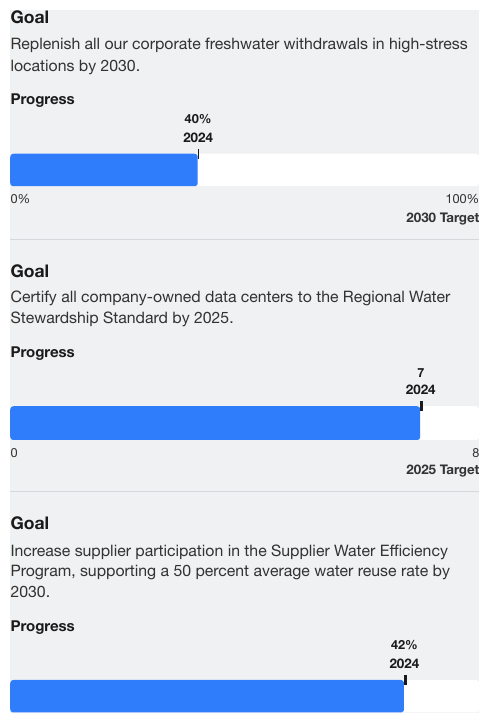
A goal statement with a single bar, its current value marked on it and the target at its right
end, is a one-row bar chart, not a chart type of its own. Its chart table MUST hold the current
value, the target and the axis end-points: the bar's meaning is relative to its scale, and 7
against 8 or 42% against 50% is only legible with that scale kept.
goal cards with progress bars
Three goal cards separated by rules. Each bar marks its current value (40%, 7, 42%, each with
the year 2024 beneath it) against a scale from its start (0%, 0) to its target (100% with
2030 Target, 8 with 2025 Target). The rows follow the axis: start, current value, target. The
third card's scale end-points fall below the crop and are not shown, so its table holds only the
current value.
Source page
Expected output
Goal
Replenish all our corporate freshwater withdrawals in high-stress locations by 2030.
| 0% | |
| 2024 | 40% |
| 2030 Target | 100% |
Goal
Certify all company-owned data centers to the Regional Water Stewardship Standard by 2025.
| 0 | |
| 2024 | 7 |
| 2025 Target | 8 |
Goal
Increase supplier participation in the Supplier Water Efficiency Program, supporting a 50 percent average water reuse rate by 2030.
| 2024 | 42% |
Look-alike
Two similar pages that call for different decisions. Synthetic, for teaching the boundary.
A highlighted average bar and a dashed average line. Which one gets a rule?
An average drawn as a bar
An ordinary rule. Highlighting is styling.
An average drawn as a line
Reference ink. No rule.
Look at the structure. What evidence changes the answer?
Neighbouring rules, and how they differ
More
Rule id charts-bars-and-histograms · charts types