Legend and Overlay Values
The numbers are printed on the marks—estimate anyway, or copy them?
✅ NormativeSettled. The requirement holds as written.📄 Page ruleCan be applied from the page alone.Read §11.2.4 in the RFC ↗
When a chart's values are printed only in its legend or as data labels over its marks, those printed numbers are the data: every one of them MUST be in the chart table, copied exactly. A companion series without printed values is estimated as usual — unless no printed label can locate its points, in which case it has no column (see Labels (§11.1.2)).
When it applies
Values print in three places, and all three are treated the same (see Values and Tolerances (§11.1.4)):
| Where the value prints | What goes in the table |
|---|---|
| On or beside each mark — bar-top numbers, slice amounts, point callouts | the printed value in the mark's cell |
In the legend — Solar (45%)-style entries |
the name part as the row or column label, the number part as the value |
| At a direct label — a line end stating its value (see Line Charts (§11.2.5)) | the printed value in the cell of that end position |
Reading the examples. Each one pairs a source page with the output the rule expects. ✅ Sample: the rule applies. ❌ Counter-sample: it looks like it applies and does not, or a rendering got it wrong. A non-conforming output, in red, is shown only for contrast. … marks content left out of an excerpt.
Examples
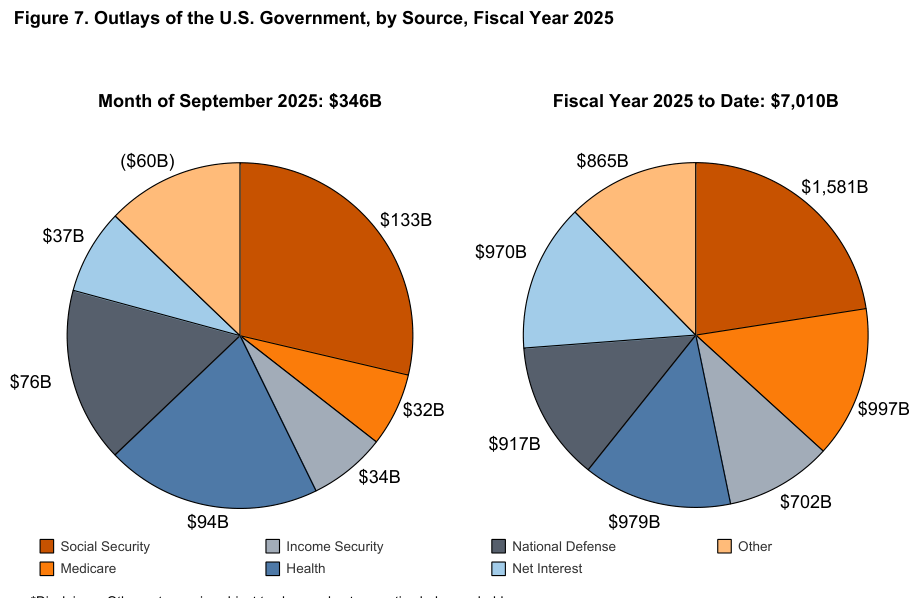
Twin pies sharing one legend, amounts printed beside the slicesMonthlyTreasuryStatement_202509_p8
Every slice name appears in both
pies with a different value, so each pie is its own table under its own printed title, and the
title is what tells them apart. Rows follow each pie clockwise from the top. The amounts are copied
as printed — $1,581B with its separator, and ($60B), whose parentheses mark the Other slice
of September as negative. The footnote under the legend is cut off at the bottom of the page and is
elided.
Source page
Source: U.S. Department of the Treasury, Monthly Treasury Statement — Figure 7 (public domain)
Expected output
| Social Security | $133B |
| Medicare | $32B |
| Income Security | $34B |
| Health | $94B |
| National Defense | $76B |
| Net Interest | $37B |
| Other | ($60B) |
| Social Security | $1,581B |
| Medicare | $997B |
| Income Security | $702B |
| Health | $979B |
| National Defense | $917B |
| Net Interest | $970B |
| Other | $865B |
…
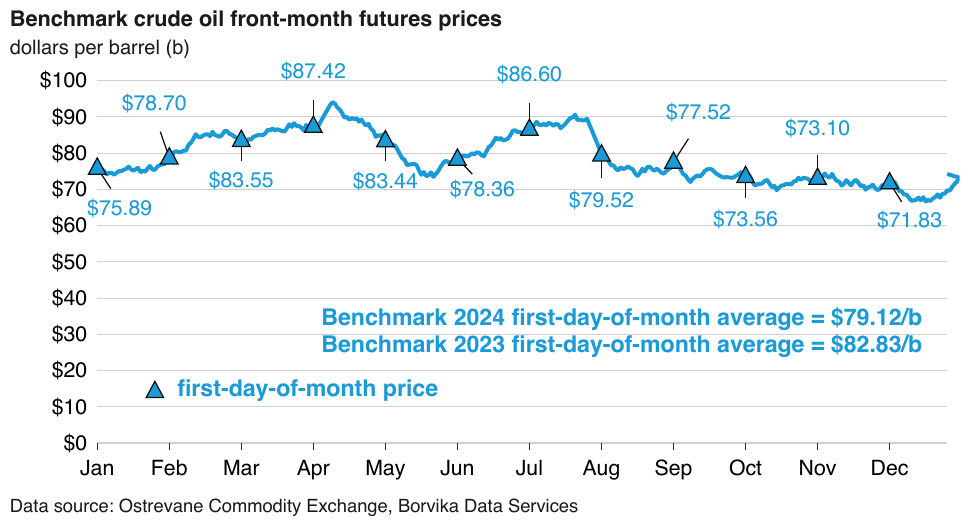
A daily price curve with no printed name or valuesupstream_financial_review_2024_p9
A daily price curve with no printed name or values, and a triangle-marker series whose legend entry
reads first-day-of-month price, all twelve of its values printed at the markers. The named series
is the table's one column: 12 printed values, copied with their $. The daily curve has no printed
name that could head a column — Jan alone also locates the marker series — so it gets no column.
The two bold average statements are printed text, not data points, and follow the table.
Source page
Expected output
dollars per barrel (b)
| first-day-of-month price | |
|---|---|
| Jan | $75.89 |
| Feb | $78.70 |
| Mar | $83.55 |
| Apr | $87.42 |
| May | $83.44 |
| Jun | $78.36 |
| Jul | $86.60 |
| Aug | $79.52 |
| Sep | $77.52 |
| Oct | $73.56 |
| Nov | $73.10 |
| Dec | $71.83 |
Benchmark 2024 first-day-of-month average = $79.12/b
Benchmark 2023 first-day-of-month average = $82.83/b
Data source: Ostrevane Commodity Exchange, Borvika Data Services
Neighbouring rules, and how they differ
More
Sample sources1 +
Public-domain U.S. federal government source material.
- U.S. Department of the Treasury, Monthly Treasury Statement — Figure 7
Rule id charts-legend-and-overlay-values · charts types