Gutter Columns
A $ or (ii) in its own gutter—its own column or part of the value?
✅ NormativeSettled. The requirement holds as written.📄 Page ruleCan be applied from the page alone.Read §9.4.1 in the RFC ↗
A currency glyph or a separator typeset in a column track of its own SHOULD be rendered in the
same cell as the value it belongs to — $ 277.09, $1,200 — $1,800. A marker numeral such as
(i) or (ii) SHOULD be rendered in a column of its own.
When it applies
Financial PDFs frequently typeset $ in its own column track, and print ranges as value — value
with the dash in a track of its own. Those tracks are real in the typesetting, but they are layout,
not data.
Printed tracks:  $ | 1,200 | — | $ | 1,800
Rendered as:     $1,200 — $1,800   (one cell)
Reading the examples. Each one pairs a source page with the output the rule expects. ✅ Sample: the rule applies. ❌ Counter-sample: it looks like it applies and does not, or a rendering got it wrong. A non-conforming output, in red, is shown only for contrast. … marks content left out of an excerpt.
Currency and separators: merged into the value
- A currency glyph printed in its own track SHOULD be rendered in the cell of the number it
belongs to. The glyph MUST NOT be dropped: where the page prints
$only on some rows, only those rows' values carry it. - A separator between the two ends of a range (a dash,
+/-,to) SHOULD be rendered in one cell with both ends. - A
$kept in a cell of its own beside its value, as a pair of cells, also conforms; the single cell is the preferred form.
$ typeset in its own column track, separate from the digits, throughout the balance sheetwarn
It is printed only on the first row of each block and on the grand total, so only those values carry it. The stub header is italic. The row labels are printed flush left, without indentation, so every label is level 0.
Source page
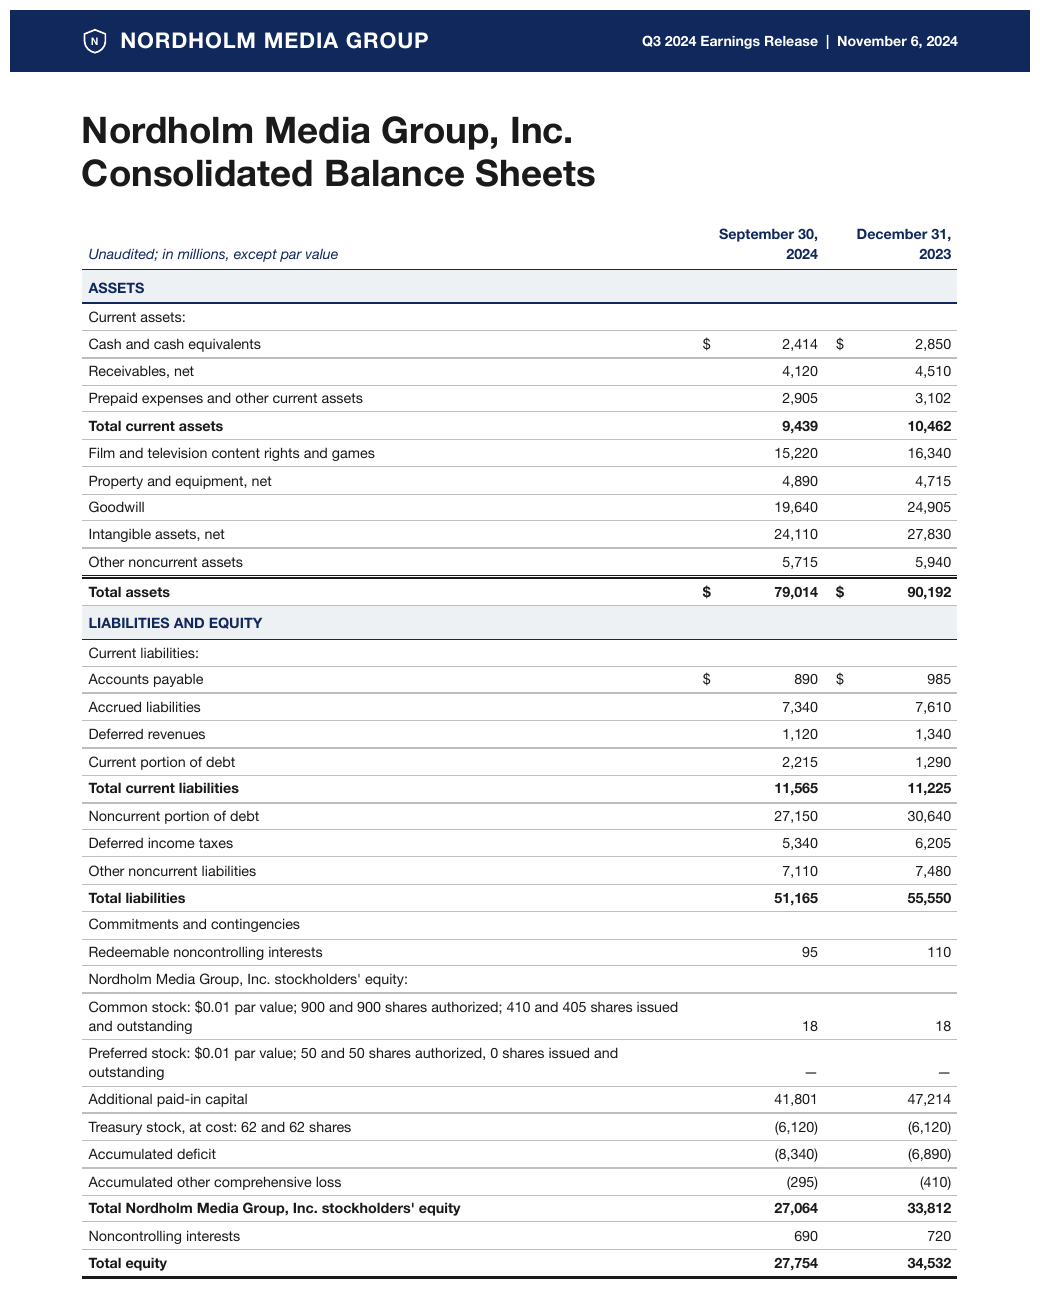
Expected output · excerpt, first block
| Unaudited; in millions, except par value | September 30, 2024 | December 31, 2023 | ||||||||||||||||||||||||||||||||||||||||||||||||||||||||||||||||||||||||||||||||||||||||||||||||
|---|---|---|---|---|---|---|---|---|---|---|---|---|---|---|---|---|---|---|---|---|---|---|---|---|---|---|---|---|---|---|---|---|---|---|---|---|---|---|---|---|---|---|---|---|---|---|---|---|---|---|---|---|---|---|---|---|---|---|---|---|---|---|---|---|---|---|---|---|---|---|---|---|---|---|---|---|---|---|---|---|---|---|---|---|---|---|---|---|---|---|---|---|---|---|---|---|---|---|
| ASSETS | ||||||||||||||||||||||||||||||||||||||||||||||||||||||||||||||||||||||||||||||||||||||||||||||||||
| Current assets: | ||||||||||||||||||||||||||||||||||||||||||||||||||||||||||||||||||||||||||||||||||||||||||||||||||
| Cash and cash equivalents | $2,414 | $2,850 | ||||||||||||||||||||||||||||||||||||||||||||||||||||||||||||||||||||||||||||||||||||||||||||||||
| Receivables, net | 4,120 | 4,510 | ||||||||||||||||||||||||||||||||||||||||||||||||||||||||||||||||||||||||||||||||||||||||||||||||
| Prepaid expenses and other current assets | 2,905 | 3,102 | ||||||||||||||||||||||||||||||||||||||||||||||||||||||||||||||||||||||||||||||||||||||||||||||||
| Total current assets | 9,439 | 10,462 | ||||||||||||||||||||||||||||||||||||||||||||||||||||||||||||||||||||||||||||||||||||||||||||||||
| Film and television content rights and games | 15,220 | 16,340 | ||||||||||||||||||||||||||||||||||||||||||||||||||||||||||||||||||||||||||||||||||||||||||||||||
| Property and equipment, net | 4,890 | 4,715 | ||||||||||||||||||||||||||||||||||||||||||||||||||||||||||||||||||||||||||||||||||||||||||||||||
| Goodwill | 19,640 | 24,905 | ||||||||||||||||||||||||||||||||||||||||||||||||||||||||||||||||||||||||||||||||||||||||||||||||
| Intangible assets, net | 24,110 | 27,830 | ||||||||||||||||||||||||||||||||||||||||||||||||||||||||||||||||||||||||||||||||||||||||||||||||
| Other noncurrent assets | 5,715 | 5,940 | ||||||||||||||||||||||||||||||||||||||||||||||||||||||||||||||||||||||||||||||||||||||||||||||||
| Total assets | $79,014 | $90,192 | ||||||||||||||||||||||||||||||||||||||||||||||||||||||||||||||||||||||||||||||||||||||||||||||||
| … | ||||||||||||||||||||||||||||||||||||||||||||||||||||||||||||||||||||||||||||||||||||||||||||||||||
The same $-gutter pattern in Halyard Genomics' cash-flow statementearn
The same $-gutter pattern in Halyard Genomics' cash-flow statement.
Source page
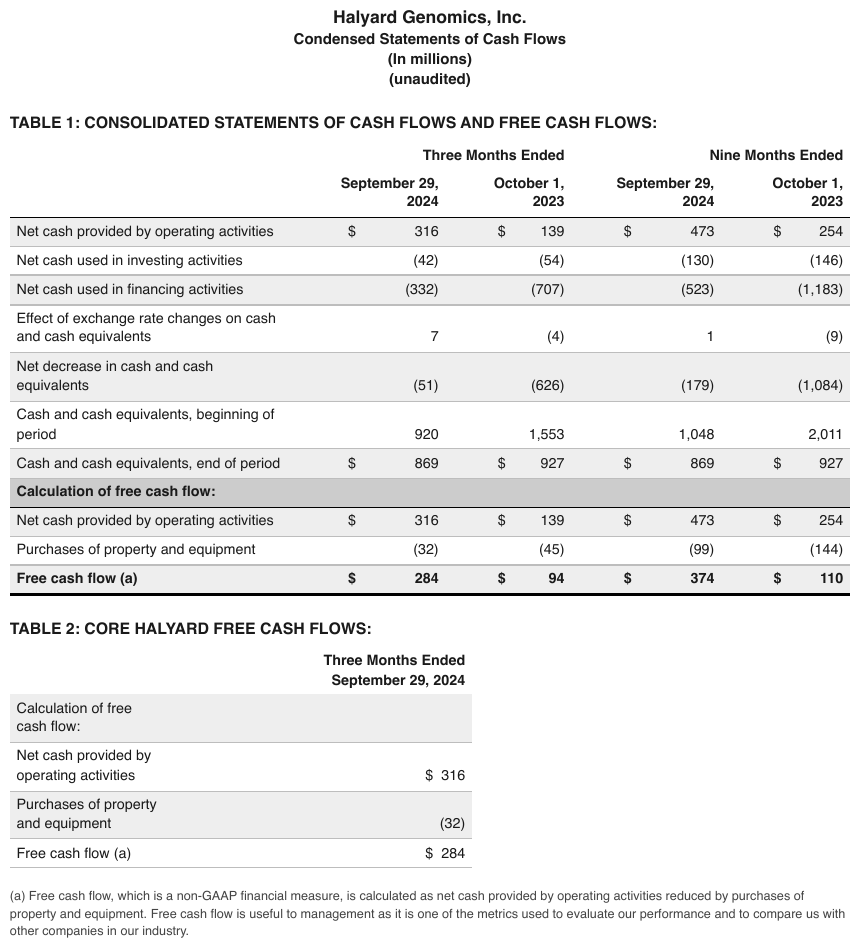
Expected output · excerpt, table 1 of 2
| Three Months Ended | Nine Months Ended | |||||||||||||||||||||||||||||||||||||||||||||||||||||||||||||||||||||||||||||||||||||||||||||||||
|---|---|---|---|---|---|---|---|---|---|---|---|---|---|---|---|---|---|---|---|---|---|---|---|---|---|---|---|---|---|---|---|---|---|---|---|---|---|---|---|---|---|---|---|---|---|---|---|---|---|---|---|---|---|---|---|---|---|---|---|---|---|---|---|---|---|---|---|---|---|---|---|---|---|---|---|---|---|---|---|---|---|---|---|---|---|---|---|---|---|---|---|---|---|---|---|---|---|---|
| September 29, 2024 | October 1, 2023 | September 29, 2024 | October 1, 2023 | |||||||||||||||||||||||||||||||||||||||||||||||||||||||||||||||||||||||||||||||||||||||||||||||
| Net cash provided by operating activities | $316 | $139 | $473 | $254 | ||||||||||||||||||||||||||||||||||||||||||||||||||||||||||||||||||||||||||||||||||||||||||||||
| Net cash used in investing activities | (42) | (54) | (130) | (146) | ||||||||||||||||||||||||||||||||||||||||||||||||||||||||||||||||||||||||||||||||||||||||||||||
| Net cash used in financing activities | (332) | (707) | (523) | (1,183) | ||||||||||||||||||||||||||||||||||||||||||||||||||||||||||||||||||||||||||||||||||||||||||||||
| Effect of exchange rate changes on cash and cash equivalents | 7 | (4) | 1 | (9) | ||||||||||||||||||||||||||||||||||||||||||||||||||||||||||||||||||||||||||||||||||||||||||||||
| Net decrease in cash and cash equivalents | (51) | (626) | (179) | (1,084) | ||||||||||||||||||||||||||||||||||||||||||||||||||||||||||||||||||||||||||||||||||||||||||||||
| Cash and cash equivalents, beginning of period | 920 | 1,553 | 1,048 | 2,011 | ||||||||||||||||||||||||||||||||||||||||||||||||||||||||||||||||||||||||||||||||||||||||||||||
| Cash and cash equivalents, end of period | $869 | $927 | $869 | $927 | ||||||||||||||||||||||||||||||||||||||||||||||||||||||||||||||||||||||||||||||||||||||||||||||
| … | ||||||||||||||||||||||||||||||||||||||||||||||||||||||||||||||||||||||||||||||||||||||||||||||||||
And again in Sablecrest Dynamics' statement of operationsearnin
And again in Sablecrest Dynamics' statement of operations — this typesetting is the norm, not an oddity. Gross profit, Gross margin and Operating income (loss) are indented one step.
Source page
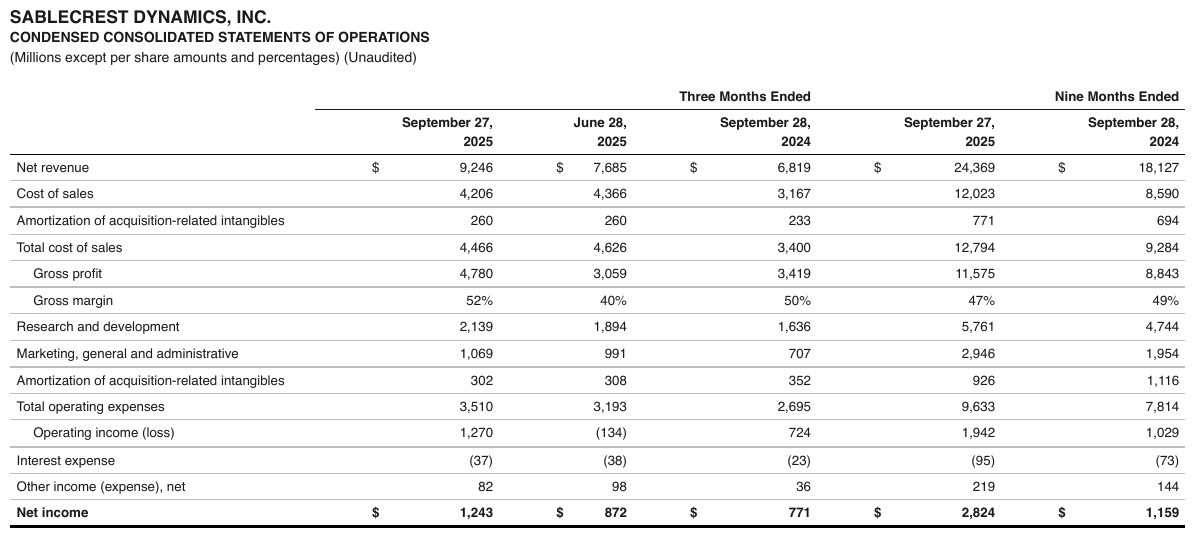
Expected output · excerpt
| Three Months Ended | Nine Months Ended | |||||||||||||||||||||||||||||||||||||||||||||||||||||||||||||||||||||||||||||||||||||||||||||||||
|---|---|---|---|---|---|---|---|---|---|---|---|---|---|---|---|---|---|---|---|---|---|---|---|---|---|---|---|---|---|---|---|---|---|---|---|---|---|---|---|---|---|---|---|---|---|---|---|---|---|---|---|---|---|---|---|---|---|---|---|---|---|---|---|---|---|---|---|---|---|---|---|---|---|---|---|---|---|---|---|---|---|---|---|---|---|---|---|---|---|---|---|---|---|---|---|---|---|---|
| September 27, 2025 | June 28, 2025 | September 28, 2024 | September 27, 2025 | September 28, 2024 | ||||||||||||||||||||||||||||||||||||||||||||||||||||||||||||||||||||||||||||||||||||||||||||||
| Net revenue | $9,246 | $7,685 | $6,819 | $24,369 | $18,127 | |||||||||||||||||||||||||||||||||||||||||||||||||||||||||||||||||||||||||||||||||||||||||||||
| Cost of sales | 4,206 | 4,366 | 3,167 | 12,023 | 8,590 | |||||||||||||||||||||||||||||||||||||||||||||||||||||||||||||||||||||||||||||||||||||||||||||
| Amortization of acquisition-related intangibles | 260 | 260 | 233 | 771 | 694 | |||||||||||||||||||||||||||||||||||||||||||||||||||||||||||||||||||||||||||||||||||||||||||||
| Total cost of sales | 4,466 | 4,626 | 3,400 | 12,794 | 9,284 | |||||||||||||||||||||||||||||||||||||||||||||||||||||||||||||||||||||||||||||||||||||||||||||
| Gross profit | 4,780 | 3,059 | 3,419 | 11,575 | 8,843 | |||||||||||||||||||||||||||||||||||||||||||||||||||||||||||||||||||||||||||||||||||||||||||||
| Gross margin | 52% | 40% | 50% | 47% | 49% | |||||||||||||||||||||||||||||||||||||||||||||||||||||||||||||||||||||||||||||||||||||||||||||
| … | ||||||||||||||||||||||||||||||||||||||||||||||||||||||||||||||||||||||||||||||||||||||||||||||||||
| Net income | $1,243 | $872 | $771 | $2,824 | $1,159 | |||||||||||||||||||||||||||||||||||||||||||||||||||||||||||||||||||||||||||||||||||||||||||||
The $ sits in its own boxed column track in the imagesome
The $ sits in its own boxed column track in the image, which looks like a column of its own. It is
not: the glyph belongs to the value, so the first value cell reads $274. The Second Quarter and
January - June spanners printed above the header are part of the table.
Source page
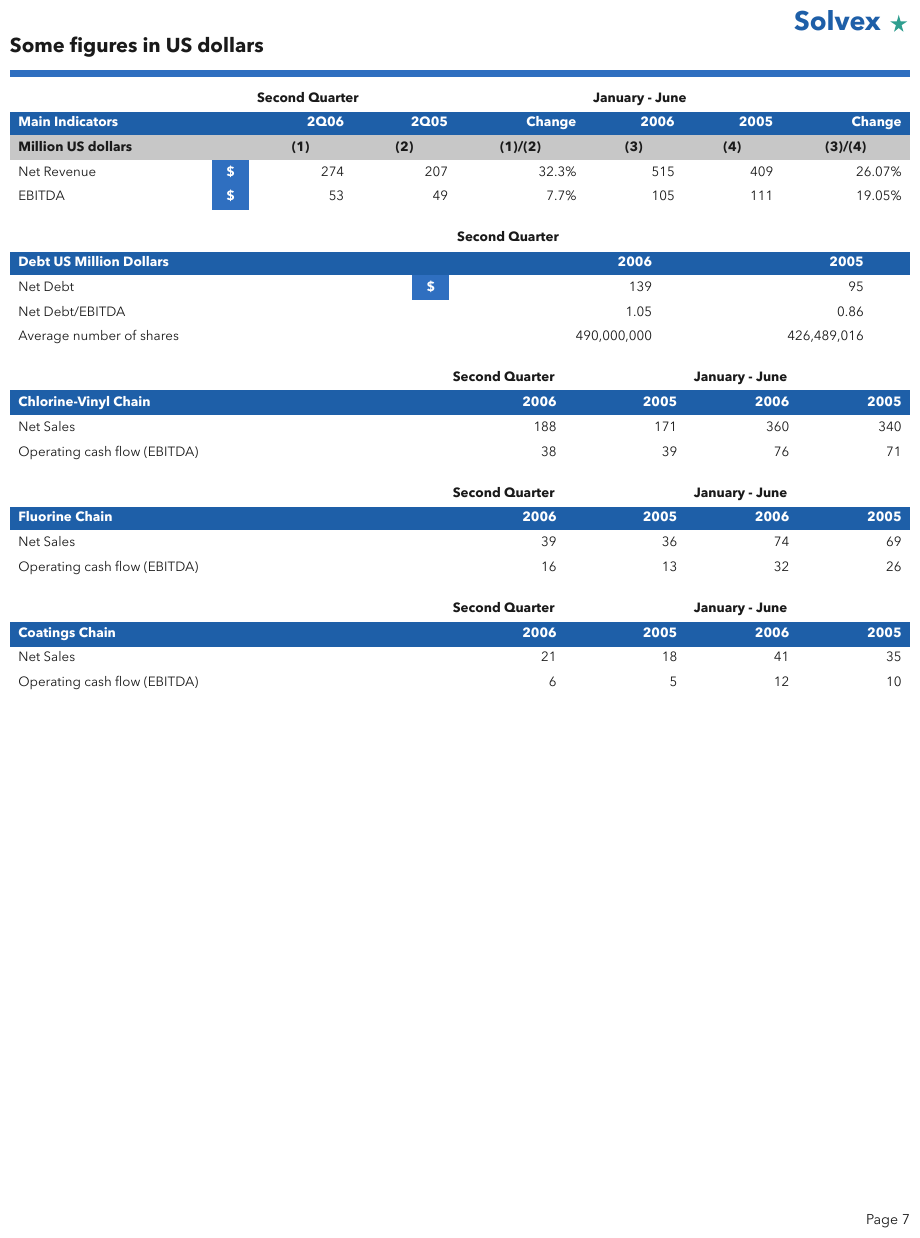
Expected output · table 1 of 5
| Second Quarter | January - June | |||||
|---|---|---|---|---|---|---|
| Main Indicators | 2Q06 | 2Q05 | Change | 2006 | 2005 | Change |
| Million US dollars | (1) | (2) | (1)/(2) | (3) | (4) | (3)/(4) |
| Net Revenue | $274 | 207 | 32.3% | 515 | 409 | 26.07% |
| EBITDA | $53 | 49 | 7.7% | 105 | 111 | 19.05% |
Marker gutters: kept as a column
| (i)  | Base salary … |     ← one column for the numeral, one for the text
| (ii) | Bonus …       |
A marker numeral such as (i) / (ii) SHOULD be rendered in a column of its own. A merged
(i) Base salary … cell also conforms, but the separate numeral column is the preferred form.
Why the two resolve opposite ways
A currency symbol is part of the value. A marker numeral is a reference label: it is cited elsewhere on the page ("see (ii)"), so it has an identity of its own and earns a column.
A gutter this rule does not name is decided by the column-count test: a track gets its own column only if a competent person modelling this data in a spreadsheet would give it one. That is the same appeal to how a person would model the content that decides Is This Even a Table (§9.1.5) — judge by the data, not by what is inked.
an operator in its own track
The Outlook table prints $5.70 Billion | +/- | $300 Million as three ruled cells, and
1.26 Billion spanning all three on the last row. The +/- track is the range dash of this
rule in another costume: one value, one cell. Merged, the GAAP and Non-GAAP ranges each become one
column and the reconciling amount sits between them; the row labels are bold.
Source page
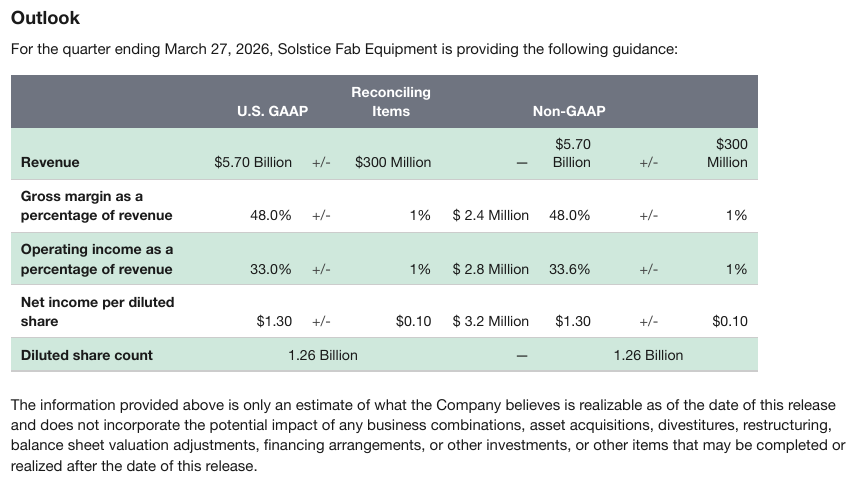
Expected output · table
| U.S. GAAP | Reconciling Items | Non-GAAP | |
|---|---|---|---|
| Revenue | $5.70 Billion +/- $300 Million | — | $5.70 Billion +/- $300 Million |
| Gross margin as a percentage of revenue | 48.0% +/- 1% | $ 2.4 Million | 48.0% +/- 1% |
| Operating income as a percentage of revenue | 33.0% +/- 1% | $ 2.8 Million | 33.6% +/- 1% |
| Net income per diluted share | $1.30 +/- $0.10 | $ 3.2 Million | $1.30 +/- $0.10 |
| Diluted share count | 1.26 Billion | — | 1.26 Billion |
a line-number column in the middle
LINE # runs 1 to 22 in a column between the labels and the first year, not at the left
edge. A marker gutter keeps its column wherever the page puts it. The column headers are italic
except FOR THE PERIOD ENDED; the empty spacer track between 2023 and 2024 prints nothing and is not
a column.
Source page
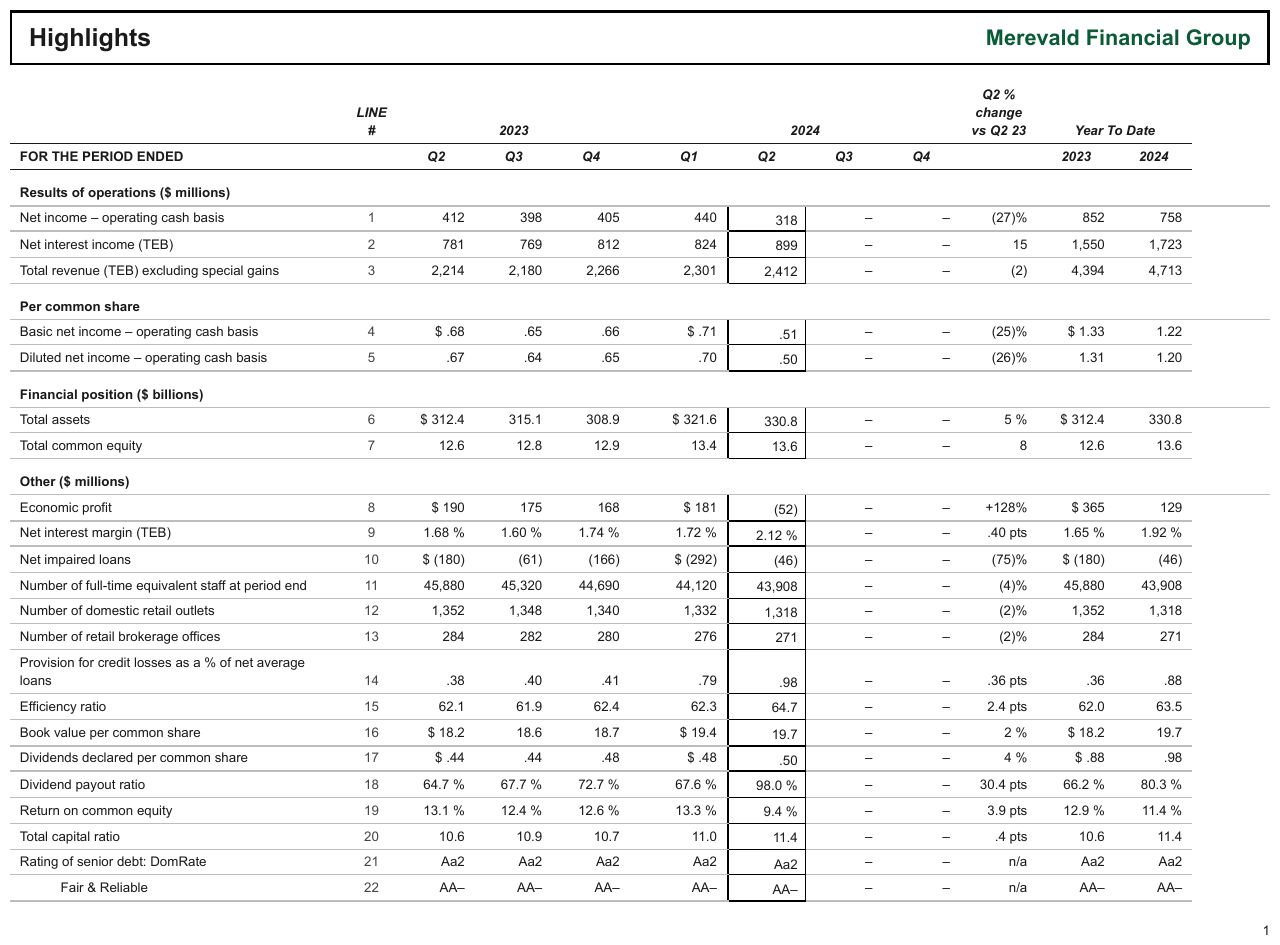
Expected output · excerpt, first two sections
| LINE # | 2023 | 2024 | Q2 % change vs Q2 23 | Year To Date | ||||||||||||||||||||||||||||||||||||||||||||||||||||||||||||||||||||||||||||||||||||||||||||||
|---|---|---|---|---|---|---|---|---|---|---|---|---|---|---|---|---|---|---|---|---|---|---|---|---|---|---|---|---|---|---|---|---|---|---|---|---|---|---|---|---|---|---|---|---|---|---|---|---|---|---|---|---|---|---|---|---|---|---|---|---|---|---|---|---|---|---|---|---|---|---|---|---|---|---|---|---|---|---|---|---|---|---|---|---|---|---|---|---|---|---|---|---|---|---|---|---|---|---|
| FOR THE PERIOD ENDED | Q2 | Q3 | Q4 | Q1 | Q2 | Q3 | Q4 | 2023 | 2024 | |||||||||||||||||||||||||||||||||||||||||||||||||||||||||||||||||||||||||||||||||||||||||
| Results of operations ($ millions) | ||||||||||||||||||||||||||||||||||||||||||||||||||||||||||||||||||||||||||||||||||||||||||||||||||
| Net income – operating cash basis | 1 | 412 | 398 | 405 | 440 | 318 | – | – | (27)% | 852 | 758 | |||||||||||||||||||||||||||||||||||||||||||||||||||||||||||||||||||||||||||||||||||||||
| Net interest income (TEB) | 2 | 781 | 769 | 812 | 824 | 899 | – | – | 15 | 1,550 | 1,723 | |||||||||||||||||||||||||||||||||||||||||||||||||||||||||||||||||||||||||||||||||||||||
| Total revenue (TEB) excluding special gains | 3 | 2,214 | 2,180 | 2,266 | 2,301 | 2,412 | – | – | (2) | 4,394 | 4,713 | |||||||||||||||||||||||||||||||||||||||||||||||||||||||||||||||||||||||||||||||||||||||
| Per common share | ||||||||||||||||||||||||||||||||||||||||||||||||||||||||||||||||||||||||||||||||||||||||||||||||||
| Basic net income – operating cash basis | 4 | $ .68 | .65 | .66 | $ .71 | .51 | – | – | (25)% | $ 1.33 | 1.22 | |||||||||||||||||||||||||||||||||||||||||||||||||||||||||||||||||||||||||||||||||||||||
| Diluted net income – operating cash basis | 5 | .67 | .64 | .65 | .70 | .50 | – | – | (26)% | 1.31 | 1.20 | |||||||||||||||||||||||||||||||||||||||||||||||||||||||||||||||||||||||||||||||||||||||
| … | ||||||||||||||||||||||||||||||||||||||||||||||||||||||||||||||||||||||||||||||||||||||||||||||||||
v. in its own track
A court daily list: time, case number and party, v., the other party, hearing type. The v.
column carries the same token on every row that has two parties and nothing on the rows that do
not — a separator track, like the range dash, so it joins the two parties in one cell. Rows with a
single In the matter of… line then take the same shape.
Source page

Expected output · excerpt, first three rows
| 10:30 | S HCI 2025 07641 Tobias Renwick Hale v. Marisa Quellan & Ors. | Post Mediation Directions Hearing | ||||||||||||||||||||||||||||||||||||||||||||||||||||||||||||||||||||||||||||||||||||||||||||||||
| 10:30 | S HCI 2026 00638 Oswin Barrow Tallis v. Denholt Legal Pty Ltd trading as Denholt Partners & Ors. | Directions Hearing | ||||||||||||||||||||||||||||||||||||||||||||||||||||||||||||||||||||||||||||||||||||||||||||||||
| 10:30 | S HCI 2026 00914 Brightvane Pty Ltd (ACN 900 437 375) v. Gideon Farrow & Ors. | Post Mediation Directions Hearing | ||||||||||||||||||||||||||||||||||||||||||||||||||||||||||||||||||||||||||||||||||||||||||||||||
| … | ||||||||||||||||||||||||||||||||||||||||||||||||||||||||||||||||||||||||||||||||||||||||||||||||||
Neighbouring rules, and how they differ
More
Rule id tables-gutter-columns · tables columns currency