Log Scale Charts
A logarithmic axis—how precisely can a mark be read?
✅ NormativeSettled. The requirement holds as written.📄 Page ruleCan be applied from the page alone.Read §11.2.6 in the RFC ↗
A logarithmic axis changes the reading, not the chart table. Unprinted values MUST be estimated against the printed decade bands, by the mark's position inside its band, and SHOULD be given to no more than two significant figures.
When it applies
On a tenfold-per-band axis the same visual gap covers ever larger ranges, so a value is
interpolated by position inside the band, not linearly: a mark a third of the way from 1 000
to 10 000 is near 2 000, not near 4 000. The tolerance a checker allows is chosen by
readability like any estimate (see Values and Tolerances (§11.1.4)).
Event callouts naming years (1976: Tangshan Earthquake, China) are commentary: they add no row or
column, and their text is kept as text (see Multiple Charts and Reference Ink (§11.1.3)).
Reading the examples. Each one pairs a source page with the output the rule expects. ✅ Sample: the rule applies. ❌ Counter-sample: it looks like it applies and does not, or a rendering got it wrong. A non-conforming output, in red, is shown only for contrast. … marks content left out of an excerpt.
Examples
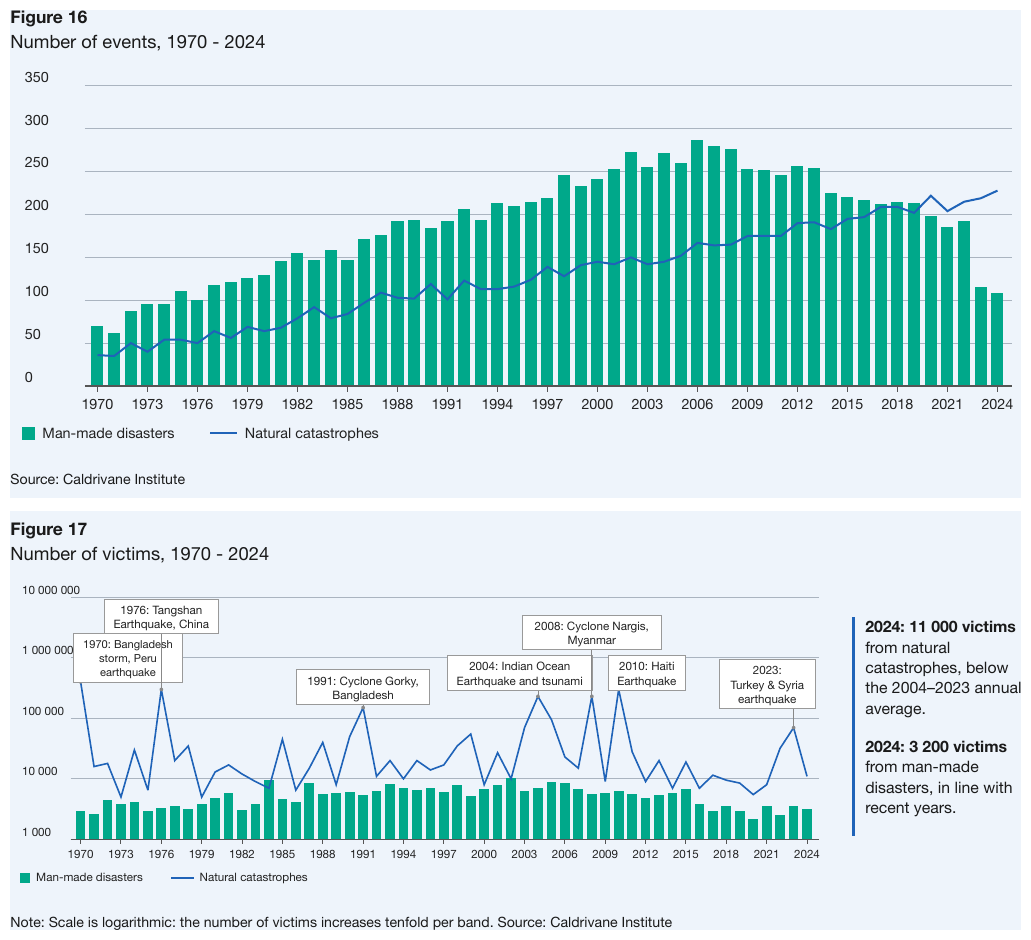
Two charts over the same 55-year axis ticked every third yearcatastrophe-review-2025_p26
event counts on a linear axis
(Figure 16) and victims on 1 000 → 10 000 000 decade bands (Figure 17). Each has its own table
under its own title, both series across all 55 years — the ticked years by their printed labels,
the years between by their axis values (1971, 2023). On the log chart, every value is a
band-position estimate to two significant figures, written in the axis's digit grouping, except
the two 2024 values, which the side text prints (11 000, 3 200): printed beats geometry, so they
are copied. The event callouts and the side text follow the log chart's table as text. Only the
first two and last two years of each table are shown.
Source page
Expected output · excerpt
| Man-made disasters | Natural catastrophes | |||||||||||||||||||||||||||||||||||||||||||||||||||||||||||||||||||||||||||||||||||||||||||||||||
|---|---|---|---|---|---|---|---|---|---|---|---|---|---|---|---|---|---|---|---|---|---|---|---|---|---|---|---|---|---|---|---|---|---|---|---|---|---|---|---|---|---|---|---|---|---|---|---|---|---|---|---|---|---|---|---|---|---|---|---|---|---|---|---|---|---|---|---|---|---|---|---|---|---|---|---|---|---|---|---|---|---|---|---|---|---|---|---|---|---|---|---|---|---|---|---|---|---|---|
| 1970 | 70 | 36 | ||||||||||||||||||||||||||||||||||||||||||||||||||||||||||||||||||||||||||||||||||||||||||||||||
| 1971 | 62 | 35 | ||||||||||||||||||||||||||||||||||||||||||||||||||||||||||||||||||||||||||||||||||||||||||||||||
| … | ||||||||||||||||||||||||||||||||||||||||||||||||||||||||||||||||||||||||||||||||||||||||||||||||||
| 2023 | 115 | 219 | ||||||||||||||||||||||||||||||||||||||||||||||||||||||||||||||||||||||||||||||||||||||||||||||||
| 2024 | 108 | 228 | ||||||||||||||||||||||||||||||||||||||||||||||||||||||||||||||||||||||||||||||||||||||||||||||||
| Man-made disasters | Natural catastrophes | |||||||||||||||||||||||||||||||||||||||||||||||||||||||||||||||||||||||||||||||||||||||||||||||||
|---|---|---|---|---|---|---|---|---|---|---|---|---|---|---|---|---|---|---|---|---|---|---|---|---|---|---|---|---|---|---|---|---|---|---|---|---|---|---|---|---|---|---|---|---|---|---|---|---|---|---|---|---|---|---|---|---|---|---|---|---|---|---|---|---|---|---|---|---|---|---|---|---|---|---|---|---|---|---|---|---|---|---|---|---|---|---|---|---|---|---|---|---|---|---|---|---|---|---|
| 1970 | 3 000 | 400 000 | ||||||||||||||||||||||||||||||||||||||||||||||||||||||||||||||||||||||||||||||||||||||||||||||||
| 1971 | 2 600 | 16 000 | ||||||||||||||||||||||||||||||||||||||||||||||||||||||||||||||||||||||||||||||||||||||||||||||||
| … | ||||||||||||||||||||||||||||||||||||||||||||||||||||||||||||||||||||||||||||||||||||||||||||||||||
| 2023 | 3 600 | 70 000 | ||||||||||||||||||||||||||||||||||||||||||||||||||||||||||||||||||||||||||||||||||||||||||||||||
| 2024 | 3 200 | 11 000 | ||||||||||||||||||||||||||||||||||||||||||||||||||||||||||||||||||||||||||||||||||||||||||||||||
1970: Bangladesh storm, Peru earthquake
1976: Tangshan Earthquake, China
1991: Cyclone Gorky, Bangladesh
2004: Indian Ocean Earthquake and tsunami
2008: Cyclone Nargis, Myanmar
2010: Haiti Earthquake
2023: Turkey & Syria earthquake
2024: 11 000 victims from natural catastrophes, below the 2004–2023 annual average.
2024: 3 200 victims from man-made disasters, in line with recent years.
Note: Scale is logarithmic: the number of victims increases tenfold per band. Source: Caldrivane Institute
Neighbouring rules, and how they differ
More
Rule id charts-log-scale-charts · charts types