Labels
Which printed text identifies a data point?
✅ NormativeSettled. The requirement holds as written.📄 Page ruleCan be applied from the page alone.Read §11.1.2 in the RFC ↗
The category labels and series names of a chart table MUST be text printed on the chart — an axis tick, a legend entry, a direct label — copied verbatim. A label MUST NOT carry unit text imported from elsewhere on the page, colour words, chart-type words or an expanded abbreviation, and two dimensions MUST NOT be merged into one label.
When it applies
Each value in a chart table is located by the labels on its row and in its column, so the labels are the lookup key of the whole table: a value under the wrong label is a wrong value.
Reading the examples. Each one pairs a source page with the output the rule expects. ✅ Sample: the rule applies. ❌ Counter-sample: it looks like it applies and does not, or a rendering got it wrong. A non-conforming output, in red, is shown only for contrast. … marks content left out of an excerpt.
Which label goes where
| Chart | Row label | Column label |
|---|---|---|
| Single series | the category (Cleaners) — see Values and Tolerances (§11.1.4) |
the series name, or the value-axis title when no name is printed |
| Two-dimensional (grouped, stacked, multi-line) | the category (China) |
the series (Ride hailing) |
| Grouped or nested categories | the category, with its printed group (axis tier) in a column of its own where the category alone repeats | the series |
A value MUST sit at the intersection of exactly the labels that locate it: its category's row and
its series' column. Dimensions stay independent — 2024 in the row and Revenue in the column,
never one label 2024 - Revenue.
Verbatim, and what "no units" means
Each label is one printed string, copied whole — SEA, > 15000,
Option-Adjusted Spread (OAS), REDBIKE (Akira), first-day-of-month price. Parentheses printed
inside a legend entry are part of the legend text and MUST be kept.
The no-units requirement forbids importing unit text from elsewhere on the page into a label.
Where the axis corner prints (millions of euros) and the tick prints 2024, the label is 2024,
not 2024 (millions of euros). Likewise Revenue, not Revenue (USD bn), when the unit prints as
an axis note rather than inside the legend entry. The unit note itself is not dropped: it stays in
the output as the chart's own text (see Cover Every Data Point (§11.1.1)).
A label MUST NOT be rewritten:
- no colour words —
Blue line - GDP GrowthisGDP Growth; - no descriptive or chart-type suffixes — no
(line), no(bars); - no expanded abbreviations —
SEAstaysSEA.
Positions the axis does not label
A position on a printed, regularly labeled axis that carries no tick label of its own is labeled
by its axis value — 2023 on a year axis ticked every third year, 2500 on a bin axis labeled
every other bin. That label is a reading against printed calibration, not invented text (see
Cover Every Data Point (§11.1.1)).
Several charts with the same labels
Each chart or panel has its own chart table with its own printed title in <caption> (see
Multiple Charts and Reference Ink (§11.1.3)), so charts that reuse one label set are told apart by their
captions, without altering their labels. The caption appears once inside the table, first or last
according to reading order (see Titles Banners Captions (§9.7.3)).
- The twin pies in Legend and Overlay Values (§11.2.4) reuse every slice name; each pie's title
(
Month of September 2025: $346B,Fiscal Year 2025 to Date: $7,010B) is what distinguishes them. - The solar panels in Multiple Charts and Reference Ink (§11.1.3) need nothing more:
Chinawith619appears only in the avoided-emissions panel.
A point that no printed label can locate is not rendered in the chart table (see Cover Every Data Point (§11.1.1)); the unnamed companion curve in Legend and Overlay Values (§11.2.4) is the standing example.
Four legend series over eight labeled regions, every value printed on its barmobility-survey-2024_p13
32 values, rows
labeled from the axis and columns from the legend, verbatim. Region abbreviations stay as printed
(SEA, ME, NEA). The values printed in heavier type are bold in the table; the red ones carry
no colour mark, since colour on a data label is styling.
Source page
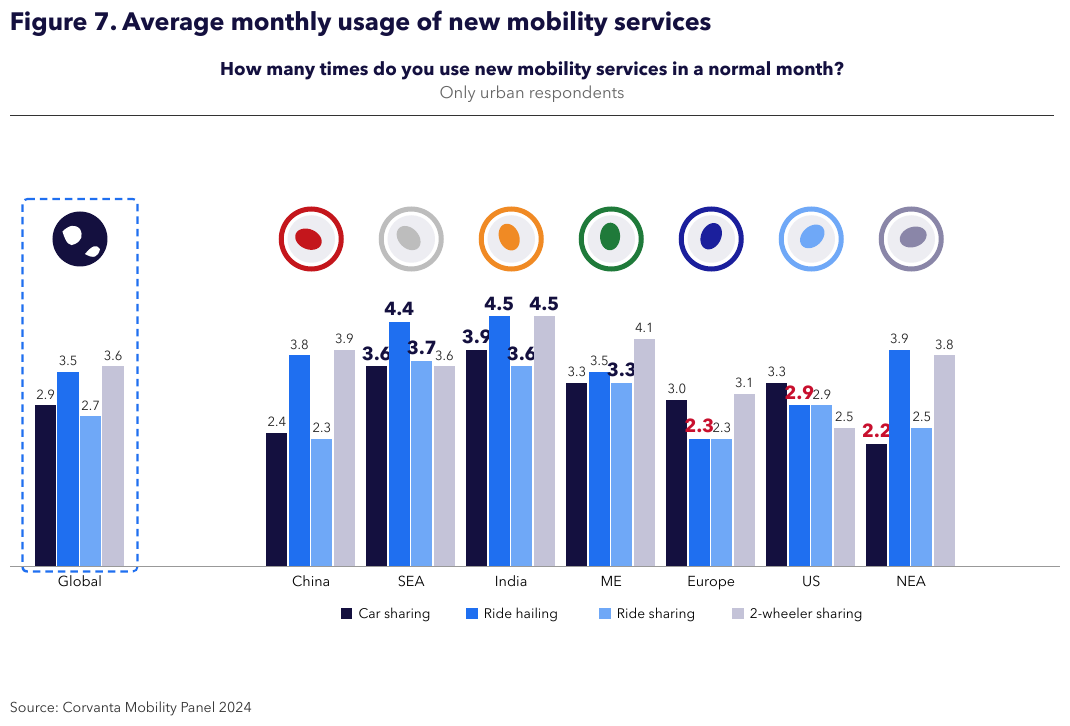
Expected output
| Car sharing | Ride hailing | Ride sharing | 2-wheeler sharing | |
|---|---|---|---|---|
| Global | 2.9 | 3.5 | 2.7 | 3.6 |
| China | 2.4 | 3.8 | 2.3 | 3.9 |
| SEA | 3.6 | 4.4 | 3.7 | 3.6 |
| India | 3.9 | 4.5 | 3.6 | 4.5 |
| ME | 3.3 | 3.5 | 3.3 | 4.1 |
| Europe | 3.0 | 2.3 | 2.3 | 3.1 |
| US | 3.3 | 2.9 | 2.9 | 2.5 |
| NEA | 2.2 | 3.9 | 2.5 | 3.8 |
Source: Corvanta Mobility Panel 2024
Neighbouring rules, and how they differ
More
Rule id charts-labels · charts labels