Multiple Charts and Reference Ink
Several panels on one page—how are their points told apart?
✅ NormativeSettled. The requirement holds as written.📄 Page ruleCan be applied from the page alone.Read §11.1.3 in the RFC ↗
Each chart or panel on a page MUST get its own chart table, and every panel MUST be covered (see Cover Every Data Point (§11.1.1)). Reference ink — labeled averages, trend lines, shaded bands, event callouts — draws no data points and MUST NOT be rendered as data: it gets no row, no column and no value in any chart table. Its printed text MUST still be kept.
Reading the examples. Each one pairs a source page with the output the rule expects. ✅ Sample: the rule applies. ❌ Counter-sample: it looks like it applies and does not, or a rendering got it wrong. A non-conforming output, in red, is shown only for contrast. … marks content left out of an excerpt.
Several charts on one page
Every chart and every panel of a multi-panel figure is its own chart table, in reading order, with
its printed title or panel heading in <caption>. The same one-row-per-position,
one-column-per-series coverage applies to each. Where charts share a label set, each table's
caption tells them apart (see Labels (§11.1.2)).
A caption shared by several panels MUST appear once: first inside the first panel's table when
read before the group, or last inside the last panel's table when read after the group. A shared
caption and that panel's own title are kept in printed order within the same <caption>.
Ink printed once for several panels — a shared axis title, a single legend serving every panel — MUST NOT be lost:
- a shared legend names the series of every panel it serves, so each panel's table carries those series names as its column headers;
- a shared axis title is printed text of the figure and is kept once, as text.
Reference ink is not data
| Reference ink | Why it is not data |
|---|---|
A labeled average or trend line (10-year average, a line fitted through a scatter) |
it summarises the data points; it is not one of them |
| A shaded band or background region | it marks a span of the axis, not a value |
An event callout naming a year (1976: Tangshan Earthquake, China — see Log Scale Charts (§11.2.6)) |
it comments on a point; its value is the point's own |
A chart table that gains a column for a trend line, or a row for a shaded band, contains values the chart never drew as data — invented content (see Never Drop, Never Invent (§2.2)). The printed labels of reference ink are text on the page, kept as text, after the table in reading order — see the chart table's layout in Cover Every Data Point (§11.1.1).
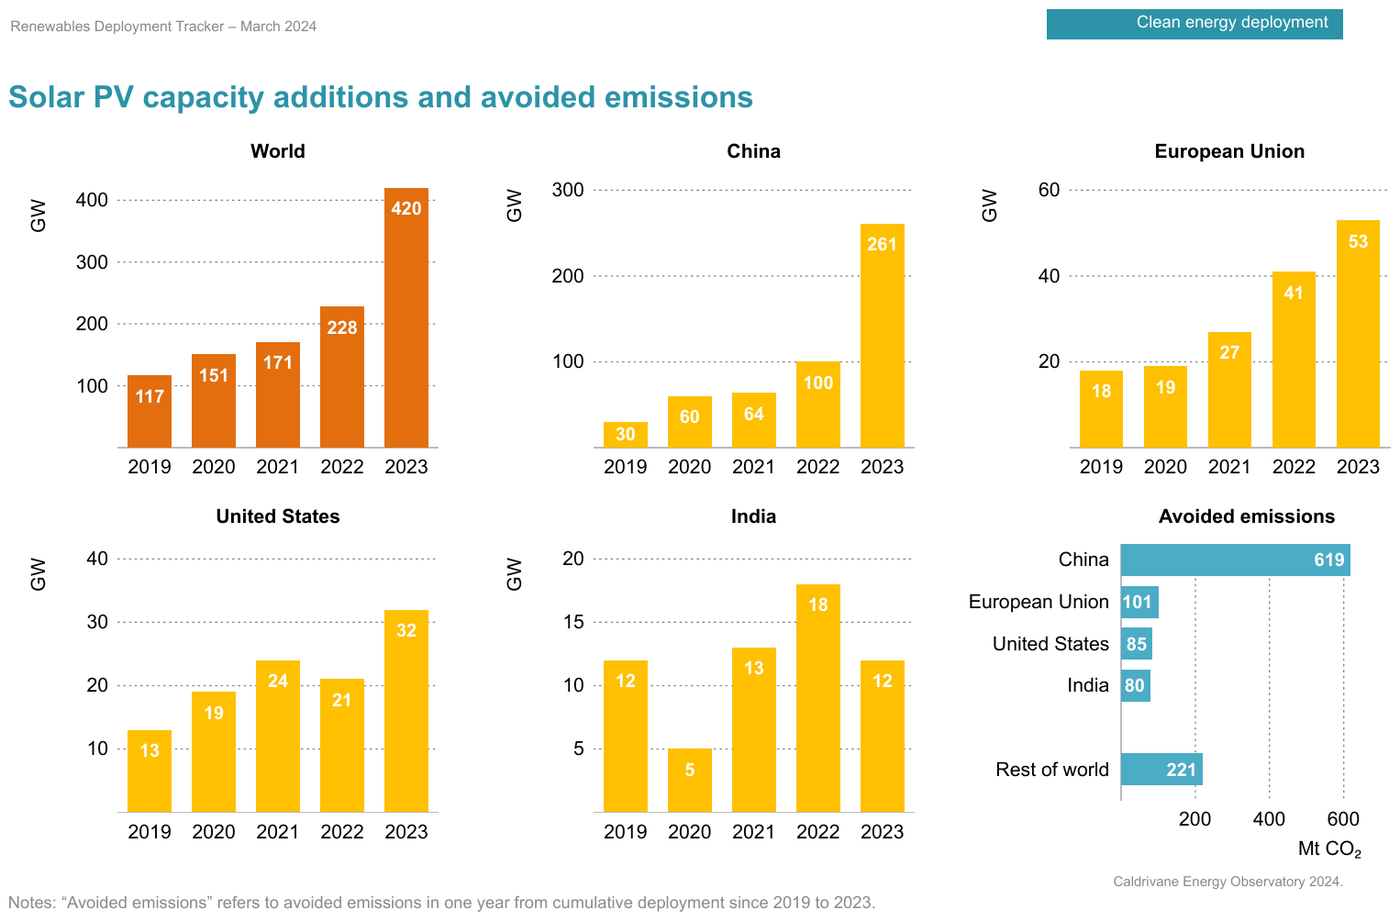
Six titled panelsRenewablesDeploymentTracker2024_p13
Six titled panels — five bar panels (World, China, European Union, United States, India)
over the same five years, and one horizontal panel (Avoided emissions) over regions — every bar
printing its value: 30 values in six tables. Each single-series panel is headed by its value-axis
title (GW, Mt CO₂). China appears both as a panel and as a row of the avoided-emissions
panel; each table's title keeps them apart. The bar values are printed in bold. The running header
and tab label are elided.
Source page
Expected output
…
| GW | |
|---|---|
| 2019 | 117 |
| 2020 | 151 |
| 2021 | 171 |
| 2022 | 228 |
| 2023 | 420 |
| GW | |
|---|---|
| 2019 | 30 |
| 2020 | 60 |
| 2021 | 64 |
| 2022 | 100 |
| 2023 | 261 |
| GW | |
|---|---|
| 2019 | 18 |
| 2020 | 19 |
| 2021 | 27 |
| 2022 | 41 |
| 2023 | 53 |
| GW | |
|---|---|
| 2019 | 13 |
| 2020 | 19 |
| 2021 | 24 |
| 2022 | 21 |
| 2023 | 32 |
| GW | |
|---|---|
| 2019 | 12 |
| 2020 | 5 |
| 2021 | 13 |
| 2022 | 18 |
| 2023 | 12 |
| Mt CO2 | |
|---|---|
| China | 619 |
| European Union | 101 |
| United States | 85 |
| India | 80 |
| Rest of world | 221 |
Caldrivane Energy Observatory 2024.
Notes: “Avoided emissions” refers to avoided emissions in one year from cumulative deployment since 2019 to 2023.
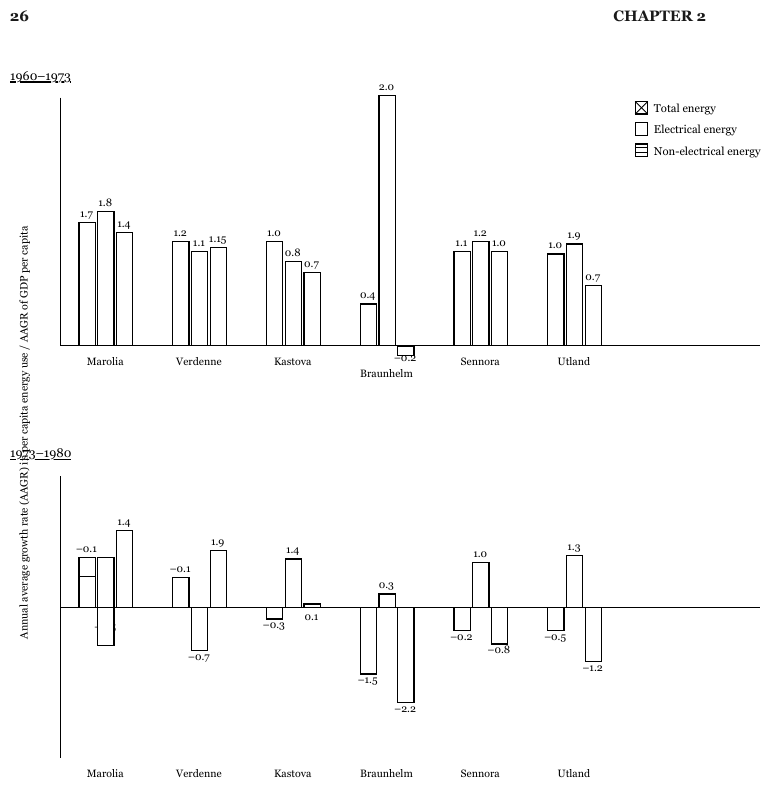
two panels sharing a legend and an axis
Two bar panels stacked vertically, each with its own underlined period caption (1960–1973,
1973–1980), over one rotated axis title on the far left and one legend that serves both. Each
panel is its own table, and both tables carry the three legend series as their headers: read alone,
the lower panel's bars are unnamed. The axis title, printed once, is kept once. Every bar prints its
value; the printed minus signs are written -. The lower panel runs negative, bars descending below
a zero line that crosses the panel. In the lower panel, the value label under Marolia's second bar
is covered by the bar itself and that bar is drawn both above and below the zero line, so the
Marolia row is elided. The running header is elided.
Source page
Expected output · excerpt
…
Annual average growth rate (AAGR) in per capita energy use / AAGR of GDP per capita
| Total energy | Electrical energy | Non-electrical energy | |
|---|---|---|---|
| Marolia | 1.7 | 1.8 | 1.4 |
| Verdenne | 1.2 | 1.1 | 1.15 |
| Kastova | 1.0 | 0.8 | 0.7 |
| Braunhelm | 0.4 | 2.0 | -0.2 |
| Sennora | 1.1 | 1.2 | 1.0 |
| Utland | 1.0 | 1.9 | 0.7 |
| Total energy | Electrical energy | Non-electrical energy | ||||||||||||||||||||||||||||||||||||||||||||||||||||||||||||||||||||||||||||||||||||||||||||||||
|---|---|---|---|---|---|---|---|---|---|---|---|---|---|---|---|---|---|---|---|---|---|---|---|---|---|---|---|---|---|---|---|---|---|---|---|---|---|---|---|---|---|---|---|---|---|---|---|---|---|---|---|---|---|---|---|---|---|---|---|---|---|---|---|---|---|---|---|---|---|---|---|---|---|---|---|---|---|---|---|---|---|---|---|---|---|---|---|---|---|---|---|---|---|---|---|---|---|---|
| … | ||||||||||||||||||||||||||||||||||||||||||||||||||||||||||||||||||||||||||||||||||||||||||||||||||
| Verdenne | -0.1 | -0.7 | 1.9 | |||||||||||||||||||||||||||||||||||||||||||||||||||||||||||||||||||||||||||||||||||||||||||||||
| Kastova | -0.3 | 1.4 | 0.1 | |||||||||||||||||||||||||||||||||||||||||||||||||||||||||||||||||||||||||||||||||||||||||||||||
| Braunhelm | -1.5 | 0.3 | -2.2 | |||||||||||||||||||||||||||||||||||||||||||||||||||||||||||||||||||||||||||||||||||||||||||||||
| Sennora | -0.2 | 1.0 | -0.8 | |||||||||||||||||||||||||||||||||||||||||||||||||||||||||||||||||||||||||||||||||||||||||||||||
| Utland | -0.5 | 1.3 | -1.2 | |||||||||||||||||||||||||||||||||||||||||||||||||||||||||||||||||||||||||||||||||||||||||||||||
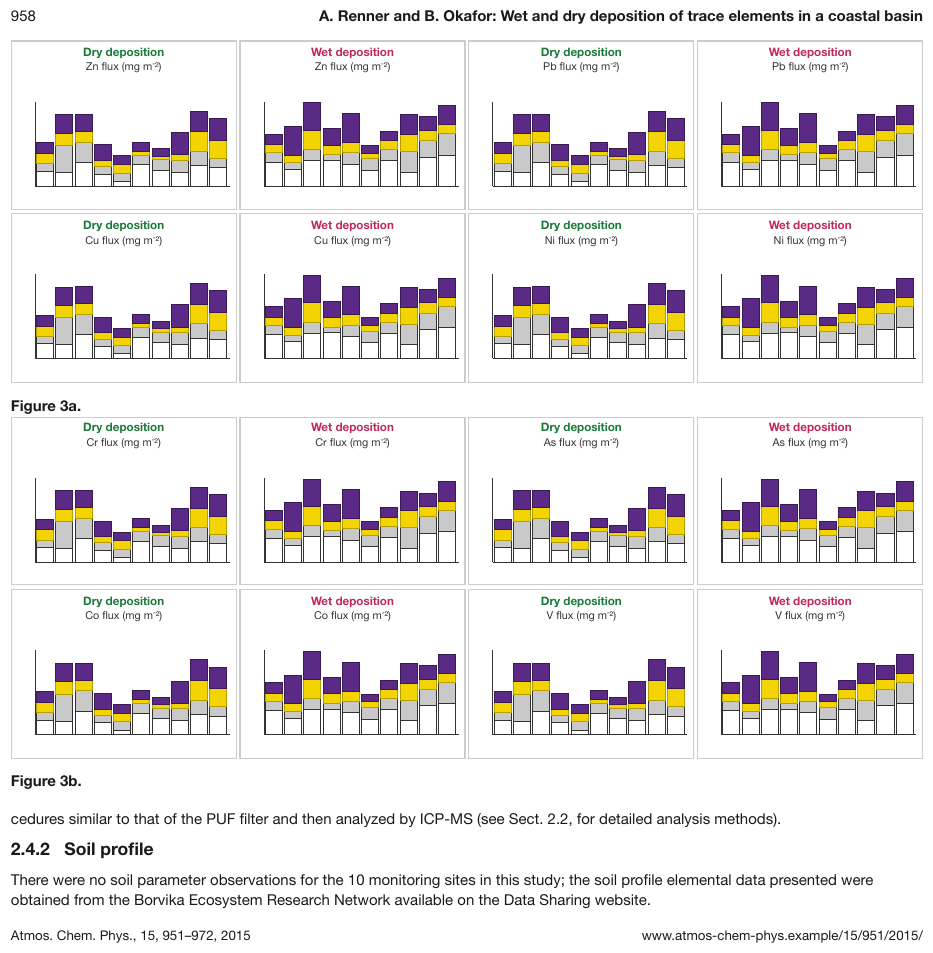
sixteen small panels under two captions
Figure 3a and Figure 3b hold eight stacked-bar panels each, every panel headed by its
deposition type and its element's flux title, each drawing ten stacks of four fill colours. No
panel prints a site name, a tick value or a legend, so no bar can be located or calibrated: the
panels carry no chart table, and the output keeps their printed headings and titles, in reading
order. Figure 3b and the text below it are elided.
Source page
Expected output · excerpt, Figure 3a
…
Dry deposition Zn flux (mg m-2)
Wet deposition Zn flux (mg m-2)
Dry deposition Pb flux (mg m-2)
Wet deposition Pb flux (mg m-2)
Dry deposition Cu flux (mg m-2)
Wet deposition Cu flux (mg m-2)
Dry deposition Ni flux (mg m-2)
Wet deposition Ni flux (mg m-2)
Figure 3a.
…
<!-- … -->

Dry deposition
Zn flux (mg m<sup>-2</sup>)

Wet deposition
Zn flux (mg m<sup>-2</sup>)

Dry deposition
Pb flux (mg m<sup>-2</sup>)

Wet deposition
Pb flux (mg m<sup>-2</sup>)

Dry deposition
Cu flux (mg m<sup>-2</sup>)

Wet deposition
Cu flux (mg m<sup>-2</sup>)

Dry deposition
Ni flux (mg m<sup>-2</sup>)

Wet deposition
Ni flux (mg m<sup>-2</sup>)

Figure 3a.

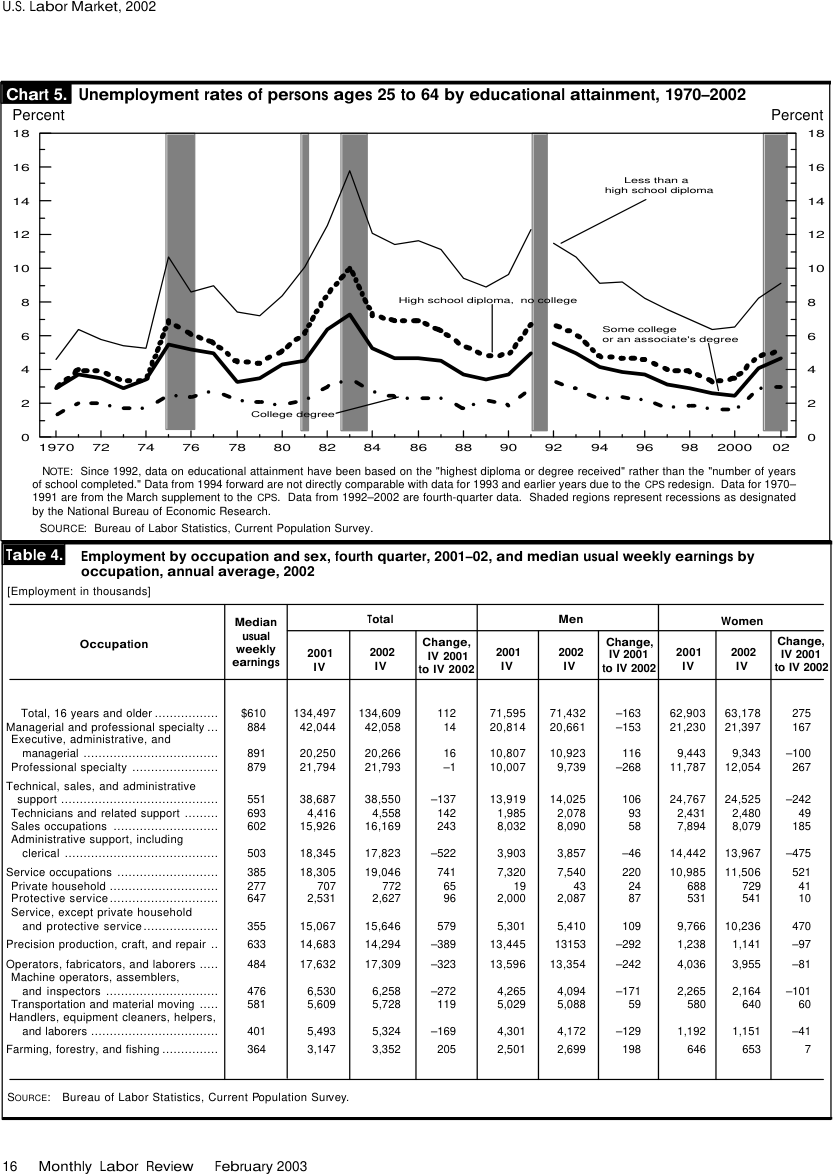
<!-- … -->recession bands behind four lines
Four line styles, each named by a direct label with a leader line, over 33 years (1970–2002, the
axis labeling every second year as 1970, 72, 74 …) and five grey vertical bands that the note
says are recessions. The four named series are the table's columns; the bands are reference ink and
add nothing to it, while the note that explains them is kept. No value is printed, so every cell is
an estimate against the 2-point grid. Only the first two labeled years are shown; the table
continues through 02, and the table sharing the page is elided.
Source page
Source: U.S. Bureau of Labor Statistics, Monthly Labor Review, February 2003, Chart 5 and Table 4 (public domain)
Expected output · excerpt
| Less than a high school diploma | High school diploma, no college | Some college or an associate's degree | College degree | |||||||||||||||||||||||||||||||||||||||||||||||||||||||||||||||||||||||||||||||||||||||||||||||
|---|---|---|---|---|---|---|---|---|---|---|---|---|---|---|---|---|---|---|---|---|---|---|---|---|---|---|---|---|---|---|---|---|---|---|---|---|---|---|---|---|---|---|---|---|---|---|---|---|---|---|---|---|---|---|---|---|---|---|---|---|---|---|---|---|---|---|---|---|---|---|---|---|---|---|---|---|---|---|---|---|---|---|---|---|---|---|---|---|---|---|---|---|---|---|---|---|---|---|
| 1970 | 4.6 | 3.1 | 2.9 | 1.3 | ||||||||||||||||||||||||||||||||||||||||||||||||||||||||||||||||||||||||||||||||||||||||||||||
| … | ||||||||||||||||||||||||||||||||||||||||||||||||||||||||||||||||||||||||||||||||||||||||||||||||||
| 72 | 5.8 | 3.9 | 3.5 | 2.0 | ||||||||||||||||||||||||||||||||||||||||||||||||||||||||||||||||||||||||||||||||||||||||||||||
| … | ||||||||||||||||||||||||||||||||||||||||||||||||||||||||||||||||||||||||||||||||||||||||||||||||||
Percent
Percent
NOTE: Since 1992, data on educational attainment have been based on the "highest diploma or degree received" rather than the "number of years of school completed." Data from 1994 forward are not directly comparable with data for 1993 and earlier years due to the CPS redesign. Data for 1970–1991 are from the March supplement to the CPS. Data from 1992–2002 are fourth-quarter data. Shaded regions represent recessions as designated by the National Bureau of Economic Research.
SOURCE: Bureau of Labor Statistics, Current Population Survey.
…
Look-alike
Two similar pages that call for different decisions. Synthetic, for teaching the boundary.
A highlighted average bar and a dashed average line. Which one gets a rule?
An average drawn as a bar
An ordinary rule. Highlighting is styling.
An average drawn as a line
Reference ink. No rule.
Look at the structure. What evidence changes the answer?
Neighbouring rules, and how they differ
More
Sample sources1 +
Public-domain U.S. federal government source material.
- U.S. Bureau of Labor Statistics, Monthly Labor Review, February 2003, Chart 5 and Table 4
Rule id charts-multiple-charts-and-reference-ink · charts structure