Accounting Number Formats
A formatted number—transcribe it or normalize it?
✅ NormativeSettled. The requirement holds as written.📄 Page ruleCan be applied from the page alone.Read §9.6.1 in the RFC ↗
Every number in a cell MUST be transcribed exactly as printed — parentheses, currency dashes, separators and change markers included. The output MUST NOT carry a normalised twin of the value beside it, and MUST NOT replace the printed form with a normalised one.
When it applies
Accounting pages print numbers in shapes that look as if they ask to be tidied up. They do not: the cell is copied character for character.
Printed:     (1,204)    $—     n/m     1.204,50 (EU)     △2.5%
Verbatim:    (1,204)    $—     n/m     1.204,50          △2.5%
Normalized:  -1204      0?     null?   1204.50           +2.5%? -2.5%?
Reading the examples. Each one pairs a source page with the output the rule expects. ✅ Sample: the rule applies. ❌ Counter-sample: it looks like it applies and does not, or a rendering got it wrong. A non-conforming output, in red, is shown only for contrast. … marks content left out of an excerpt.
Requirements
| Printed form | Requirement |
|---|---|
Parenthesised negative — (1,204), (2.0)%, ($8.75) |
MUST keep its parentheses; MUST NOT be rewritten with a minus sign. |
Leading minus — -50.009 |
MUST stay a leading minus; MUST NOT be converted into parentheses. The page's convention is the one recorded. |
Currency and percent dashes — $—, — % |
MUST stay dashes, with their currency or percent sign. |
Placeholders — n/m, NM, anything printed in place of a figure |
MUST be transcribed as written. |
Separators — 1.074.778, 1.204,50 |
MUST stay as printed: thousands points stay points, a decimal comma stays a comma, and no separator is removed or swapped for the other convention. |
Change markers — △2.5% |
MUST stay attached to the number, in the same cell. |
Spacing printed inside a value — 3.8 %, $ 17,565.8 — is part of the printed form and is kept.
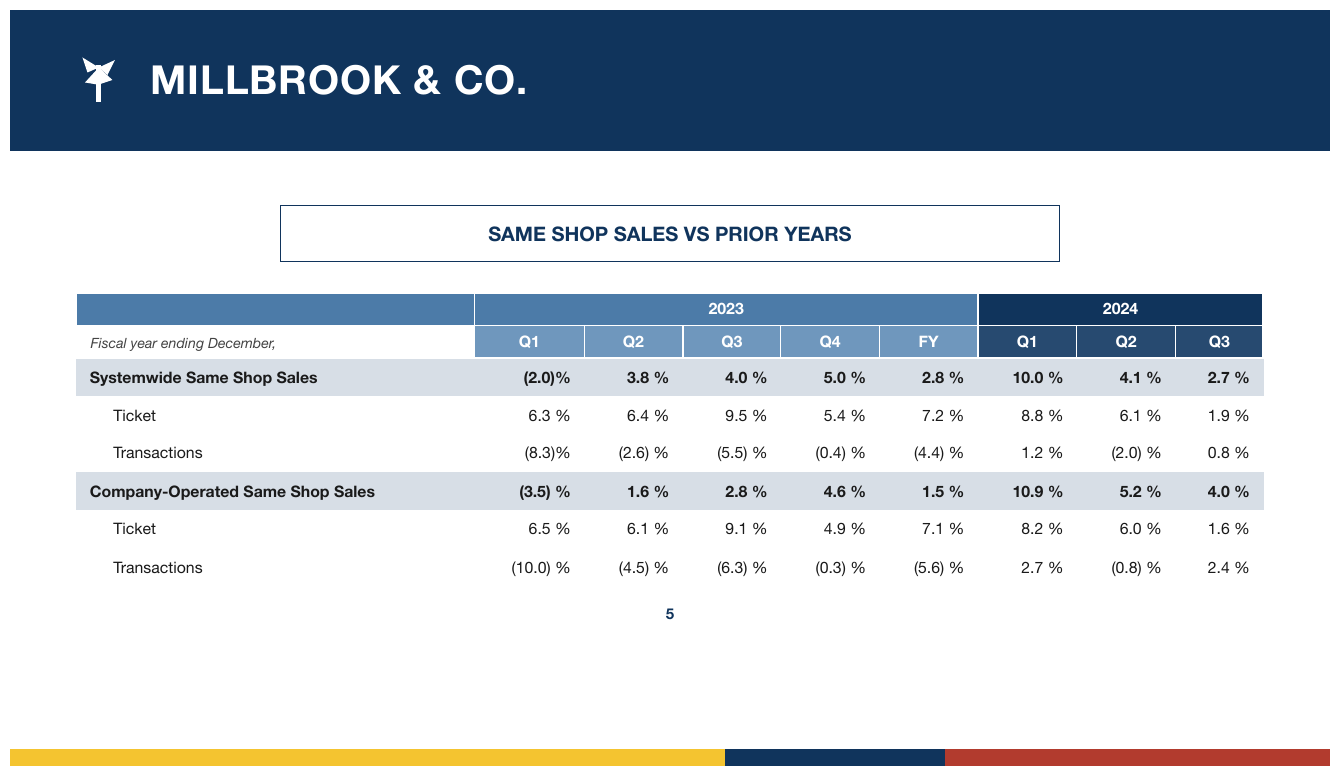
Negative percentages as (2.0)% and (8.3)%sssa
Negative percentages as (2.0)% and (8.3)%, and elsewhere with a space before the percent sign,
(2.6) %, (3.5) % — each kept as printed. The two parent rows are bold in every cell; Ticket
and Transactions are indented under them.
Source page
Expected output
| 2023 | 2024 | |||||||
|---|---|---|---|---|---|---|---|---|
| Fiscal year ending December, | Q1 | Q2 | Q3 | Q4 | FY | Q1 | Q2 | Q3 |
| Systemwide Same Shop Sales | (2.0)% | 3.8 % | 4.0 % | 5.0 % | 2.8 % | 10.0 % | 4.1 % | 2.7 % |
| Ticket | 6.3 % | 6.4 % | 9.5 % | 5.4 % | 7.2 % | 8.8 % | 6.1 % | 1.9 % |
| Transactions | (8.3)% | (2.6) % | (5.5) % | (0.4) % | (4.4) % | 1.2 % | (2.0) % | 0.8 % |
| Company-Operated Same Shop Sales | (3.5) % | 1.6 % | 2.8 % | 4.6 % | 1.5 % | 10.9 % | 5.2 % | 4.0 % |
| Ticket | 6.5 % | 6.1 % | 9.1 % | 4.9 % | 7.1 % | 8.2 % | 6.0 % | 1.6 % |
| Transactions | (10.0) % | (4.5) % | (6.3) % | (0.3) % | (5.6) % | 2.7 % | (0.8) % | 2.4 % |
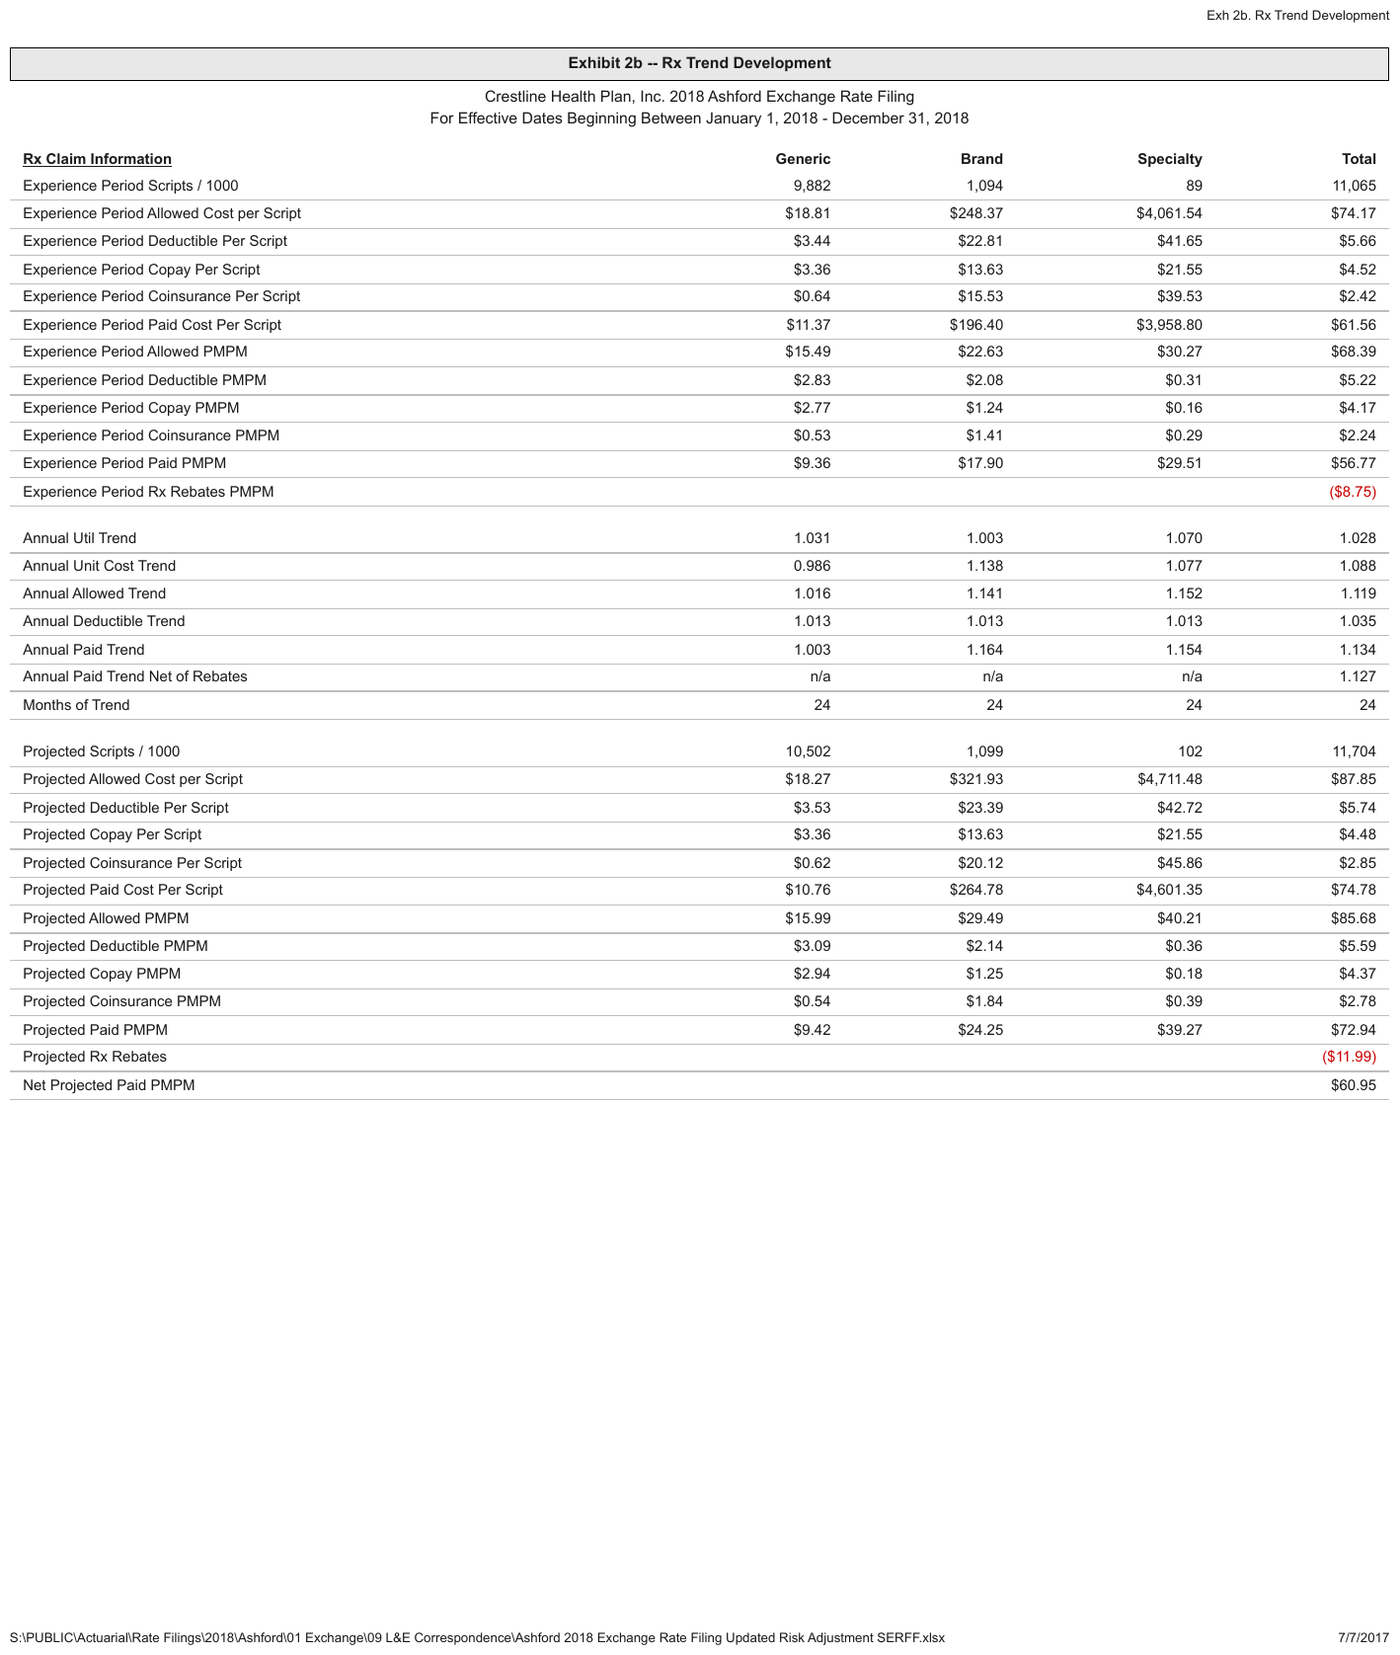
Parenthesised negatives printed in red — ($8.75), ($11.99)e22
The parentheses already carry the sign, so the red is decoration and the text is kept as printed. The column headings are bold as a row; Rx Claim Information is also underlined.
Source page
Expected output · excerpt
| Rx Claim Information | Generic | Brand | Specialty | Total | ||||||||||||||||||||||||||||||||||||||||||||||||||||||||||||||||||||||||||||||||||||||||||||||
|---|---|---|---|---|---|---|---|---|---|---|---|---|---|---|---|---|---|---|---|---|---|---|---|---|---|---|---|---|---|---|---|---|---|---|---|---|---|---|---|---|---|---|---|---|---|---|---|---|---|---|---|---|---|---|---|---|---|---|---|---|---|---|---|---|---|---|---|---|---|---|---|---|---|---|---|---|---|---|---|---|---|---|---|---|---|---|---|---|---|---|---|---|---|---|---|---|---|---|
| … | ||||||||||||||||||||||||||||||||||||||||||||||||||||||||||||||||||||||||||||||||||||||||||||||||||
| Experience Period Paid PMPM | $9.36 | $17.90 | $29.51 | $56.77 | ||||||||||||||||||||||||||||||||||||||||||||||||||||||||||||||||||||||||||||||||||||||||||||||
| Experience Period Rx Rebates PMPM | ($8.75) | |||||||||||||||||||||||||||||||||||||||||||||||||||||||||||||||||||||||||||||||||||||||||||||||||
| … | ||||||||||||||||||||||||||||||||||||||||||||||||||||||||||||||||||||||||||||||||||||||||||||||||||
| Projected Paid PMPM | $9.42 | $24.25 | $39.27 | $72.94 | ||||||||||||||||||||||||||||||||||||||||||||||||||||||||||||||||||||||||||||||||||||||||||||||
| Projected Rx Rebates | ($11.99) | |||||||||||||||||||||||||||||||||||||||||||||||||||||||||||||||||||||||||||||||||||||||||||||||||
| Net Projected Paid PMPM | $60.95 | |||||||||||||||||||||||||||||||||||||||||||||||||||||||||||||||||||||||||||||||||||||||||||||||||
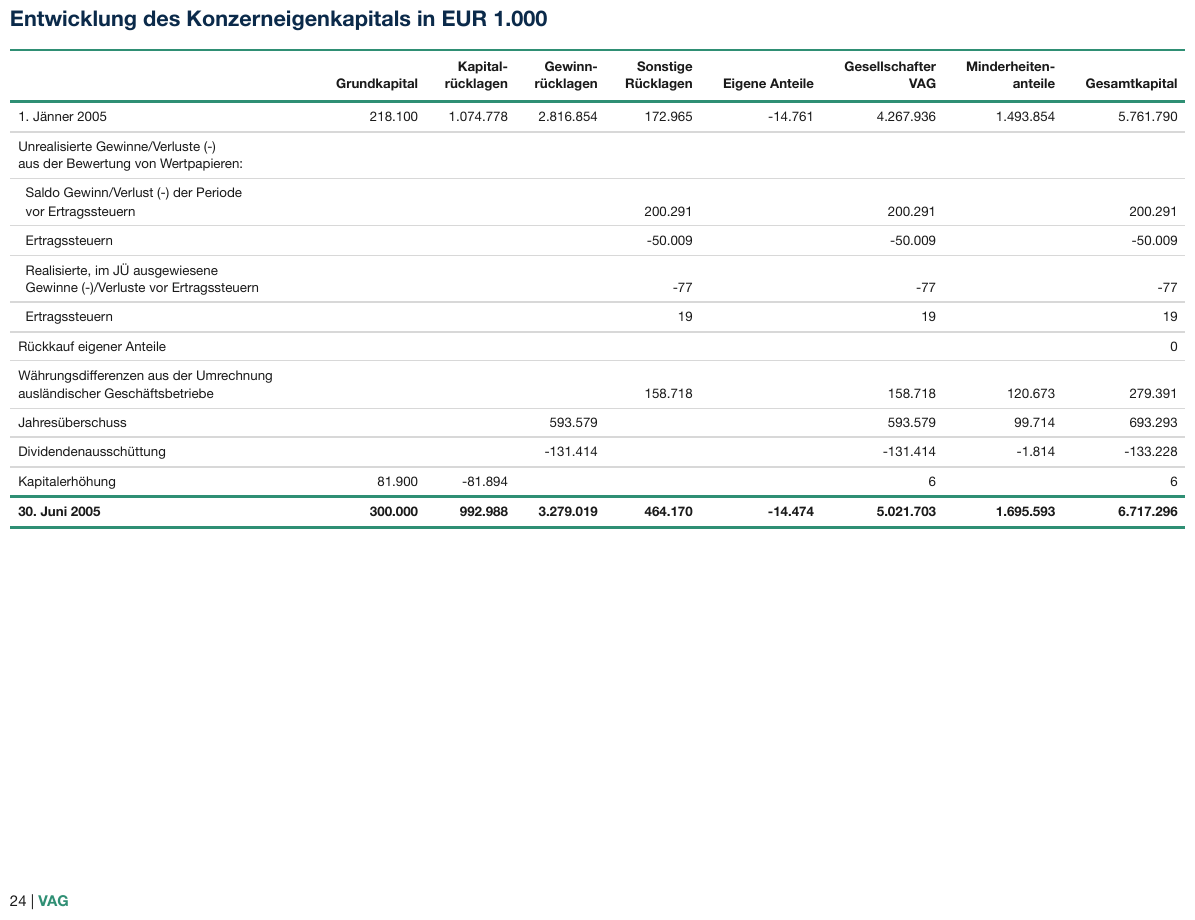
German conventionsentwick
1.074.778 with thousands points, and -50.009 with a leading minus rather
than parentheses. Cells the page leaves blank stay empty. The column headings wrap inside words at
printed hyphens (Kapital- / rücklagen), so each is one label; the closing row is bold.Source page
Expected output
| Grundkapital | Kapitalrücklagen | Gewinnrücklagen | Sonstige Rücklagen | Eigene Anteile | Gesellschafter VAG | Minderheitenanteile | Gesamtkapital | |
|---|---|---|---|---|---|---|---|---|
| 1. Jänner 2005 | 218.100 | 1.074.778 | 2.816.854 | 172.965 | -14.761 | 4.267.936 | 1.493.854 | 5.761.790 |
| Unrealisierte Gewinne/Verluste (-) aus der Bewertung von Wertpapieren: | ||||||||
| Saldo Gewinn/Verlust (-) der Periode vor Ertragssteuern | 200.291 | 200.291 | 200.291 | |||||
| Ertragssteuern | -50.009 | -50.009 | -50.009 | |||||
| Realisierte, im JÜ ausgewiesene Gewinne (-)/Verluste vor Ertragssteuern | -77 | -77 | -77 | |||||
| Ertragssteuern | 19 | 19 | 19 | |||||
| Rückkauf eigener Anteile | 0 | |||||||
| Währungsdifferenzen aus der Umrechnung ausländischer Geschäftsbetriebe | 158.718 | 158.718 | 120.673 | 279.391 | ||||
| Jahresüberschuss | 593.579 | 593.579 | 99.714 | 693.293 | ||||
| Dividendenausschüttung | -131.414 | -131.414 | -1.814 | -133.228 | ||||
| Kapitalerhöhung | 81.900 | -81.894 | 6 | 6 | ||||
| 30. Juni 2005 | 300.000 | 992.988 | 3.279.019 | 464.170 | -14.474 | 5.021.703 | 1.695.593 | 6.717.296 |
Why no normalised twin
A cleaned-up value beside the printed one looks free to produce and saves every consumer the same work. It is refused for two reasons.
Normalisation here is not a transformation, it is a guess. A "clean" column would have to decide
things the page does not say: is $— zero, or not applicable? Is n/m null, an empty string, or a
string literal? Does △2.5% mean up or down — the triangle's direction is conventional and the sign
is not printed at all. A twin column would carry three guesses dressed as data, and nothing
downstream distinguishes a guessed value from a read one.
A second value is a second thing to be wrong. The printed form is verifiable against the page; the derived form is verifiable only against whatever rules produced it. A consumer that needs a number applies its own conventions to the printed string — and it knows its own conventions, which the producer does not.
Hence: one value per cell, and it is the one on the page. Verbatim leaves the interpretation to whoever consumes the table, the only place it can be made safely.
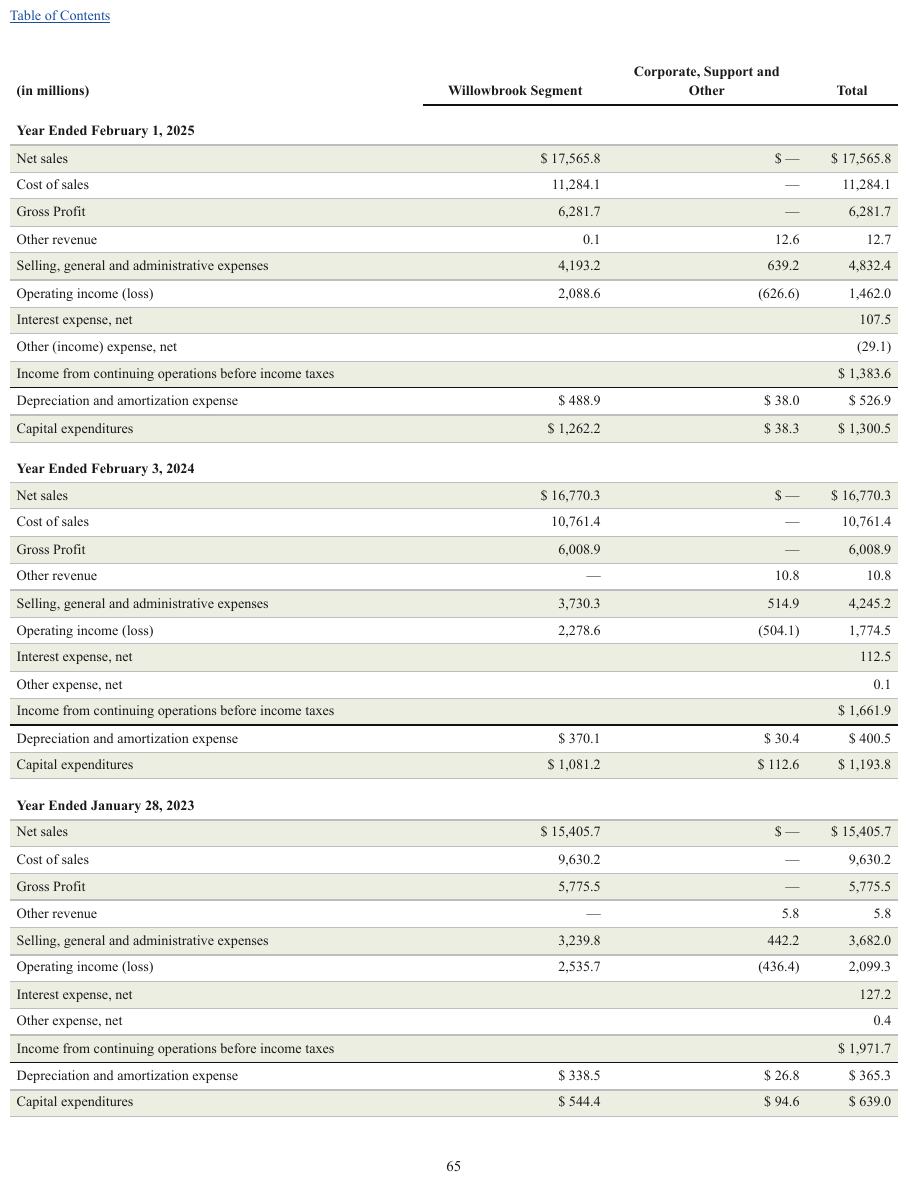
$yef
$ — for a nil value beside (626.6) parenthesised negatives, and a bare — in the rows below.
The page sets a space between $ and the figure, and it is kept. The year line is a bold band
across the grid, rendered as a spanning header cell.
Source page
Expected output · excerpt, first year block
| (in millions) | Willowbrook Segment | Corporate, Support and Other | Total | |||||||||||||||||||||||||||||||||||||||||||||||||||||||||||||||||||||||||||||||||||||||||||||||
|---|---|---|---|---|---|---|---|---|---|---|---|---|---|---|---|---|---|---|---|---|---|---|---|---|---|---|---|---|---|---|---|---|---|---|---|---|---|---|---|---|---|---|---|---|---|---|---|---|---|---|---|---|---|---|---|---|---|---|---|---|---|---|---|---|---|---|---|---|---|---|---|---|---|---|---|---|---|---|---|---|---|---|---|---|---|---|---|---|---|---|---|---|---|---|---|---|---|---|
| Year Ended February 1, 2025 | ||||||||||||||||||||||||||||||||||||||||||||||||||||||||||||||||||||||||||||||||||||||||||||||||||
| Net sales | $ 17,565.8 | $ — | $ 17,565.8 | |||||||||||||||||||||||||||||||||||||||||||||||||||||||||||||||||||||||||||||||||||||||||||||||
| Cost of sales | 11,284.1 | — | 11,284.1 | |||||||||||||||||||||||||||||||||||||||||||||||||||||||||||||||||||||||||||||||||||||||||||||||
| Gross Profit | 6,281.7 | — | 6,281.7 | |||||||||||||||||||||||||||||||||||||||||||||||||||||||||||||||||||||||||||||||||||||||||||||||
| Other revenue | 0.1 | 12.6 | 12.7 | |||||||||||||||||||||||||||||||||||||||||||||||||||||||||||||||||||||||||||||||||||||||||||||||
| Selling, general and administrative expenses | 4,193.2 | 639.2 | 4,832.4 | |||||||||||||||||||||||||||||||||||||||||||||||||||||||||||||||||||||||||||||||||||||||||||||||
| Operating income (loss) | 2,088.6 | (626.6) | 1,462.0 | |||||||||||||||||||||||||||||||||||||||||||||||||||||||||||||||||||||||||||||||||||||||||||||||
| Interest expense, net | 107.5 | |||||||||||||||||||||||||||||||||||||||||||||||||||||||||||||||||||||||||||||||||||||||||||||||||
| Other (income) expense, net | (29.1) | |||||||||||||||||||||||||||||||||||||||||||||||||||||||||||||||||||||||||||||||||||||||||||||||||
| Income from continuing operations before income taxes | $ 1,383.6 | |||||||||||||||||||||||||||||||||||||||||||||||||||||||||||||||||||||||||||||||||||||||||||||||||
| Depreciation and amortization expense | $ 488.9 | $ 38.0 | $ 526.9 | |||||||||||||||||||||||||||||||||||||||||||||||||||||||||||||||||||||||||||||||||||||||||||||||
| Capital expenditures | $ 1,262.2 | $ 38.3 | $ 1,300.5 | |||||||||||||||||||||||||||||||||||||||||||||||||||||||||||||||||||||||||||||||||||||||||||||||
| … | ||||||||||||||||||||||||||||||||||||||||||||||||||||||||||||||||||||||||||||||||||||||||||||||||||
(8)%wdb
(8)%, NM and — % in one table — three different ways of writing not a number here, each
kept as printed. The years sit on the second header line with an empty ruled cell beneath them, so
they take no rowspan. The row labels are bold; the Total revenues and Adjusted EBITDA rows
are bold in every cell.
Source page
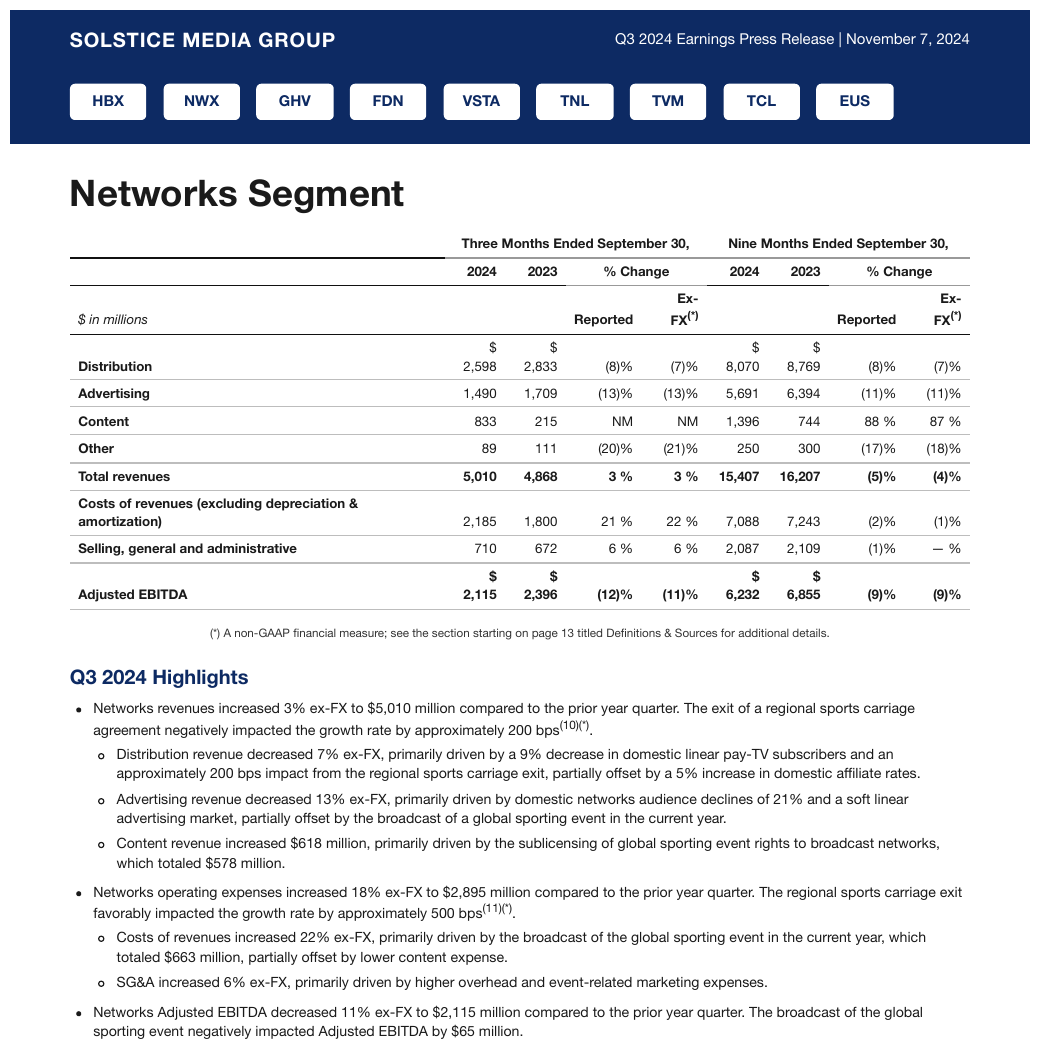
Expected output
| Three Months Ended September 30, | Nine Months Ended September 30, | |||||||
|---|---|---|---|---|---|---|---|---|
| 2024 | 2023 | % Change | 2024 | 2023 | % Change | |||
| $ in millions | Reported | Ex-FX(*) | Reported | Ex-FX(*) | ||||
| Distribution | $ 2,598 | $ 2,833 | (8)% | (7)% | $ 8,070 | $ 8,769 | (8)% | (7)% |
| Advertising | 1,490 | 1,709 | (13)% | (13)% | 5,691 | 6,394 | (11)% | (11)% |
| Content | 833 | 215 | NM | NM | 1,396 | 744 | 88 % | 87 % |
| Other | 89 | 111 | (20)% | (21)% | 250 | 300 | (17)% | (18)% |
| Total revenues | 5,010 | 4,868 | 3 % | 3 % | 15,407 | 16,207 | (5)% | (4)% |
| Costs of revenues (excluding depreciation & amortization) | 2,185 | 1,800 | 21 % | 22 % | 7,088 | 7,243 | (2)% | (1)% |
| Selling, general and administrative | 710 | 672 | 6 % | 6 % | 2,087 | 2,109 | (1)% | — % |
| Adjusted EBITDA | $ 2,115 | $ 2,396 | (12)% | (11)% | $ 6,232 | $ 6,855 | (9)% | (9)% |
Neighbouring rules, and how they differ
More
Rule id tables-accounting-number-formats · tables fidelity numbers