Maps and Treemaps
A tile with no printed value—estimate its area or leave it?
✅ NormativeSettled. The requirement holds as written.📄 Page ruleCan be applied from the page alone.Read §11.2.7 in the RFC ↗
A treemap MUST be rendered with one row per tile: the tile's label and its printed value. Tile area MUST NOT be turned into a value: no axis calibrates it. A map with printed values per region MUST be rendered with one row per printed region–value pair. A shading-only map with a discrete legend MUST give each region whose fill matches one swatch unambiguously that legend class, copied verbatim.
Reading the examples. Each one pairs a source page with the output the rule expects. ✅ Sample: the rule applies. ❌ Counter-sample: it looks like it applies and does not, or a rendering got it wrong. A non-conforming output, in red, is shown only for contrast. … marks content left out of an excerpt.
Treemaps
A tile's printed value is copied as printed. A tile that prints no value, only a comparator
(<1%), or a truncated label (Re…) gets no estimated value: its printed text is kept as it is,
and nothing is read from its area.
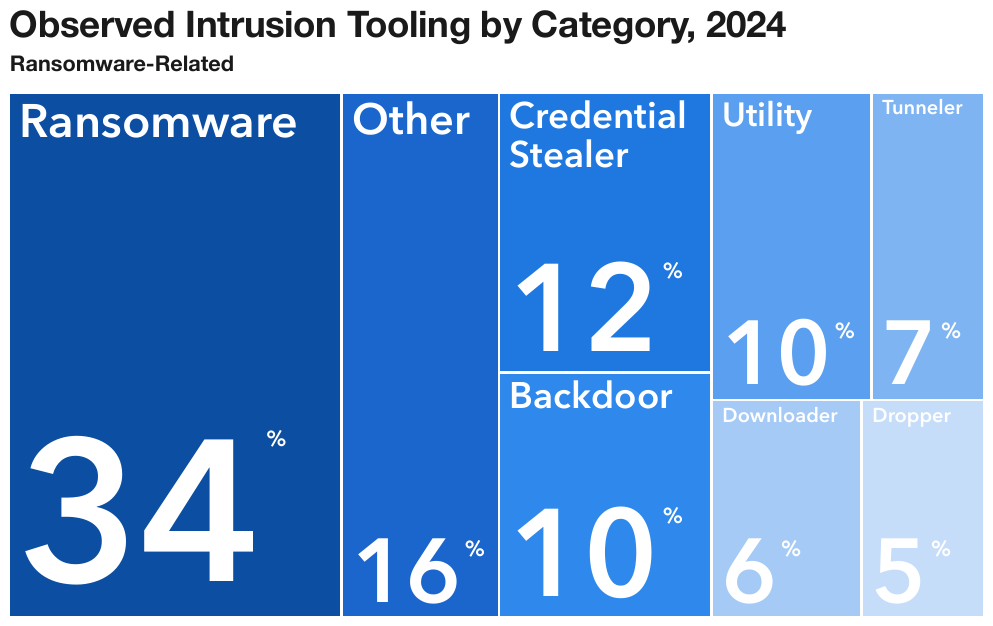
Every tile prints its label and sharethreat-report-2025_p29
eight rows in reading order, left to right and top to bottom. The percent sign is printed raised beside each number and is written as a superscript. All tile text is set in a heavier weight.
Source page
Expected output
| Ransomware | 34% |
| Other | 16% |
| Credential Stealer | 12% |
| Utility | 10% |
| Tunneler | 7% |
| Backdoor | 10% |
| Downloader | 6% |
| Dropper | 5% |
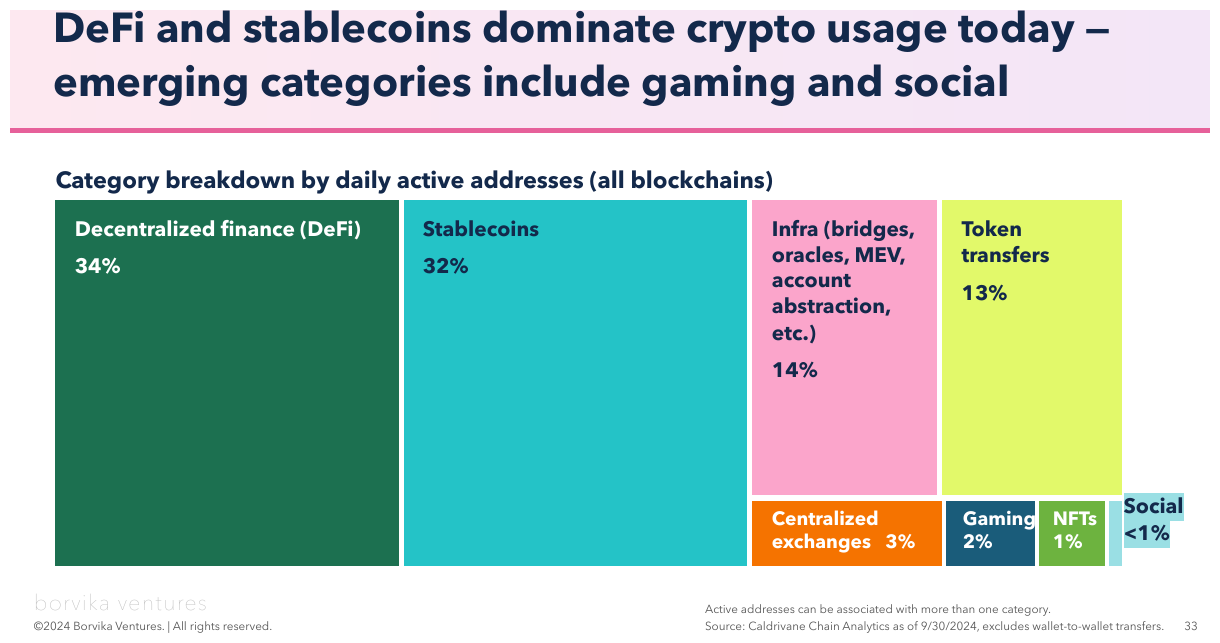
Eight tiles, every label copied whole, parenthesis and allcrypto_usage_report2024_p33
Seven print a number and the eighth,
Social, prints <1% — a comparator, not a value. Its row keeps the printed <1%; no value is
estimated from the sliver it draws. The footer's logo, copyright line and page number are elided.
Source page
Expected output
| Decentralized finance (DeFi) | 34% |
| Stablecoins | 32% |
| Infra (bridges, oracles, MEV, account abstraction, etc.) | 14% |
| Token transfers | 13% |
| Centralized exchanges | 3% |
| Gaming | 2% |
| NFTs | 1% |
| Social | <1% |
…
Active addresses can be associated with more than one category. Source: Caldrivane Chain Analytics as of 9/30/2024, excludes wallet-to-wallet transfers.
…
Maps
Two readable layers, each with its own place in the table (see also Geographic Maps (§12.2.4)):
- Values printed per region or per pin — one row per printed pair: the region or callout text
as the label, the printed value copied as printed. A callout on a leader line (
DE 1) is read like any other. - Shading with a discrete legend — each region's fill is compared with the legend swatches, and the region takes the legend class verbatim. A region whose fill falls between two adjacent swatches is given no class.
Where a map's classes go. A choropleth MUST be one table with one row per region, in reading
order: the region label, its printed value when it has one, and its legend class in a last column
headed by the legend's printed title (no header row when the legend has none). A region with an
ambiguous fill has an empty class cell. Where the region names are recognised from the outlines
rather than printed, the region column's header carries data-recognised — see Geographic Maps (§12.2.4).
A checker judges a class on meaning: it accepts the class string, an equivalent range, or a value
inside the class's range, and treats region-name variants (CO / Colorado) as the same region.
Both layers on one pageapport_p19
every state prints its seat count, and the fill classes its change, so
each state's row holds both — 50 states. Five states are shown, then the rest; the DE 1 callout on
a leader line is read like any other. Delaware's fill is too small to compare with the swatches,
so its class cell is empty. The agency footer is elided.
Source page
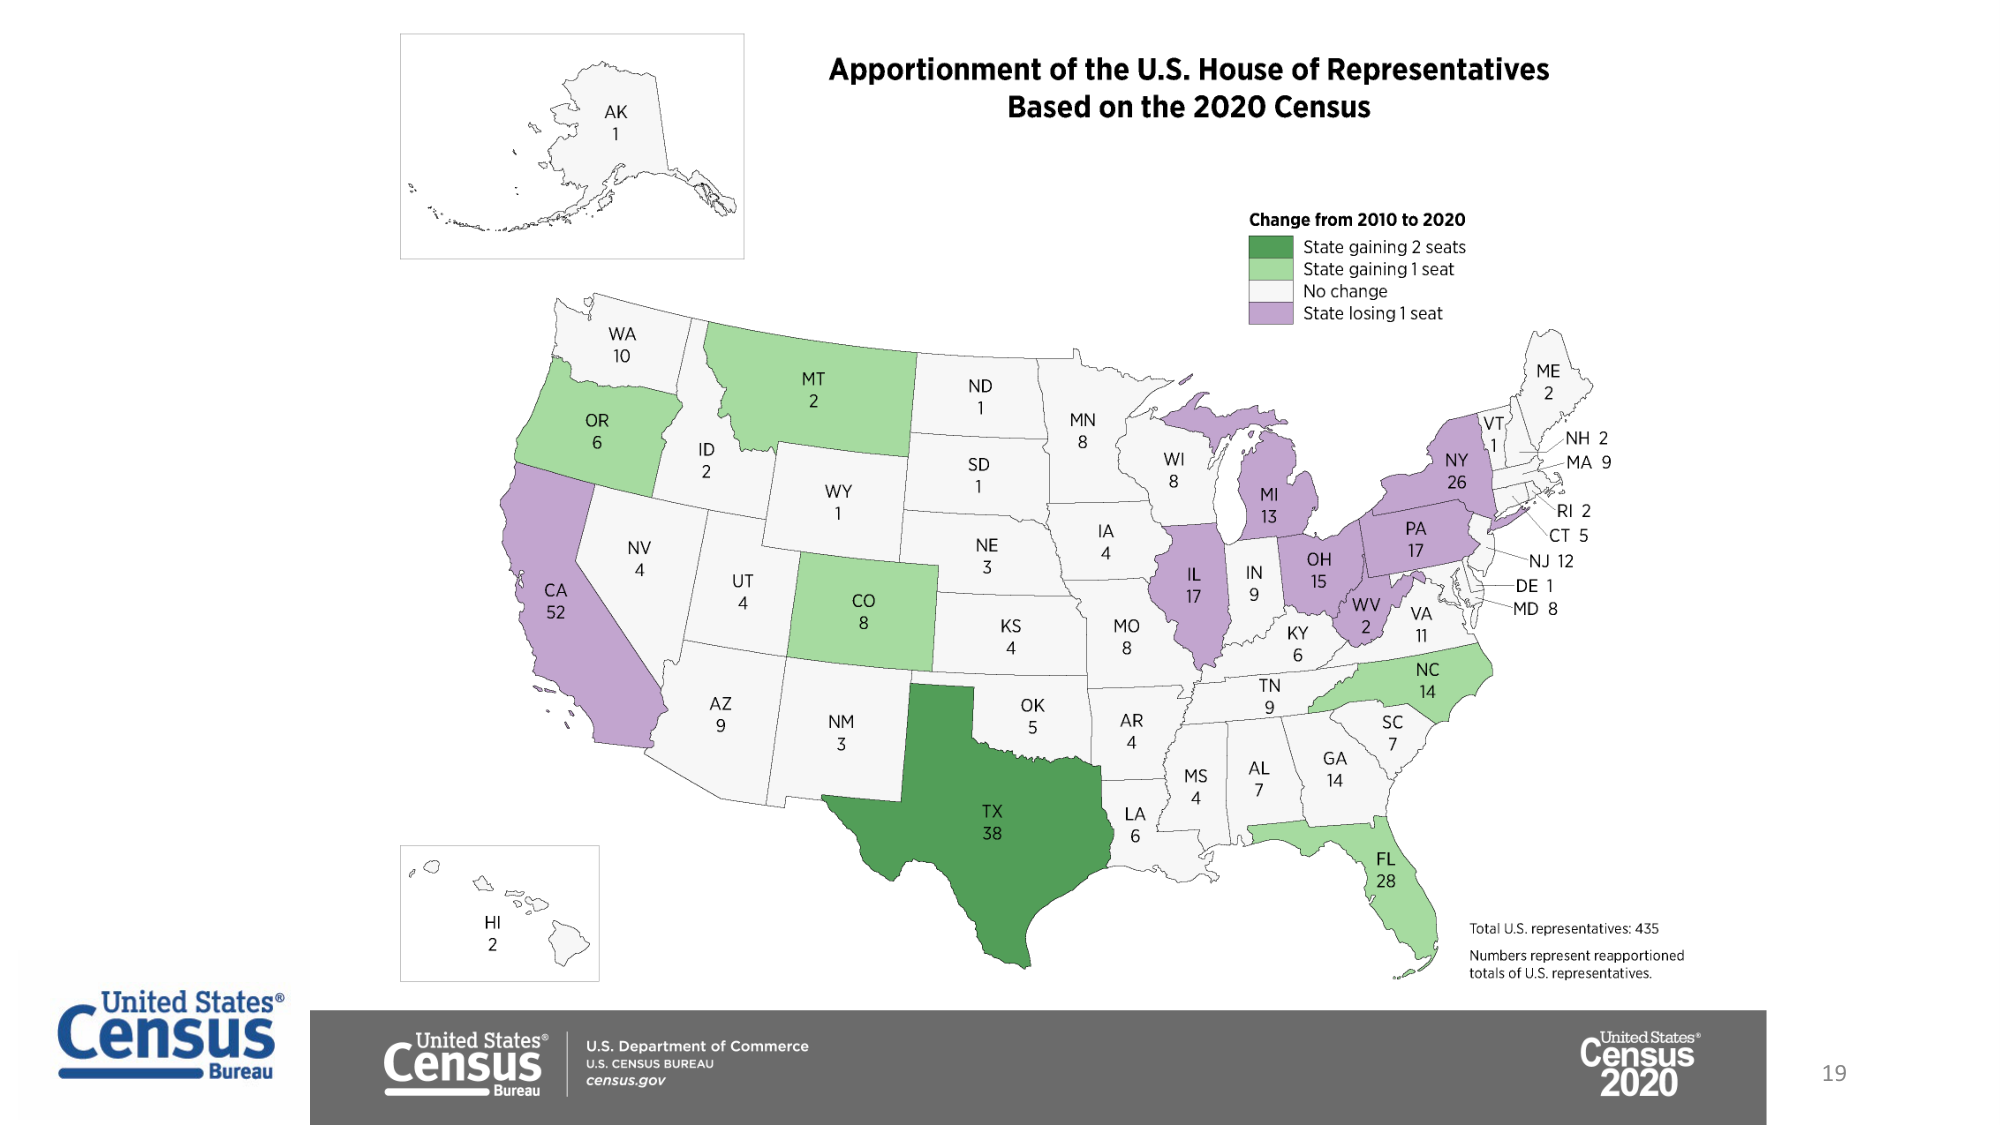
Source: U.S. Census Bureau, Apportionment of the U.S. House of Representatives Based on the 2020 Census (public domain)
Expected output · excerpt
| Change from 2010 to 2020 | ||||||||||||||||||||||||||||||||||||||||||||||||||||||||||||||||||||||||||||||||||||||||||||||||||
|---|---|---|---|---|---|---|---|---|---|---|---|---|---|---|---|---|---|---|---|---|---|---|---|---|---|---|---|---|---|---|---|---|---|---|---|---|---|---|---|---|---|---|---|---|---|---|---|---|---|---|---|---|---|---|---|---|---|---|---|---|---|---|---|---|---|---|---|---|---|---|---|---|---|---|---|---|---|---|---|---|---|---|---|---|---|---|---|---|---|---|---|---|---|---|---|---|---|---|
| TX | 38 | State gaining 2 seats | ||||||||||||||||||||||||||||||||||||||||||||||||||||||||||||||||||||||||||||||||||||||||||||||||
| OR | 6 | State gaining 1 seat | ||||||||||||||||||||||||||||||||||||||||||||||||||||||||||||||||||||||||||||||||||||||||||||||||
| WY | 1 | No change | ||||||||||||||||||||||||||||||||||||||||||||||||||||||||||||||||||||||||||||||||||||||||||||||||
| CA | 52 | State losing 1 seat | ||||||||||||||||||||||||||||||||||||||||||||||||||||||||||||||||||||||||||||||||||||||||||||||||
| DE | 1 | |||||||||||||||||||||||||||||||||||||||||||||||||||||||||||||||||||||||||||||||||||||||||||||||||
| … | ||||||||||||||||||||||||||||||||||||||||||||||||||||||||||||||||||||||||||||||||||||||||||||||||||
Total U.S. representatives: 435
Numbers represent reapportioned totals of U.S. representatives.
…
No values anywhere — state abbreviations printed, six legend classes, no legend titlecdc_p3
Each region
takes its class: every state, DC and territory shown (about 53 regions). Four regions spread across
the classes are shown, then the rest. The legend draws ≥35% as a > glyph over an underline bar;
≥35% is the reading, and a checker treats >35% as the same class. The source lines are cut off
at the page edge and are elided.
Source page
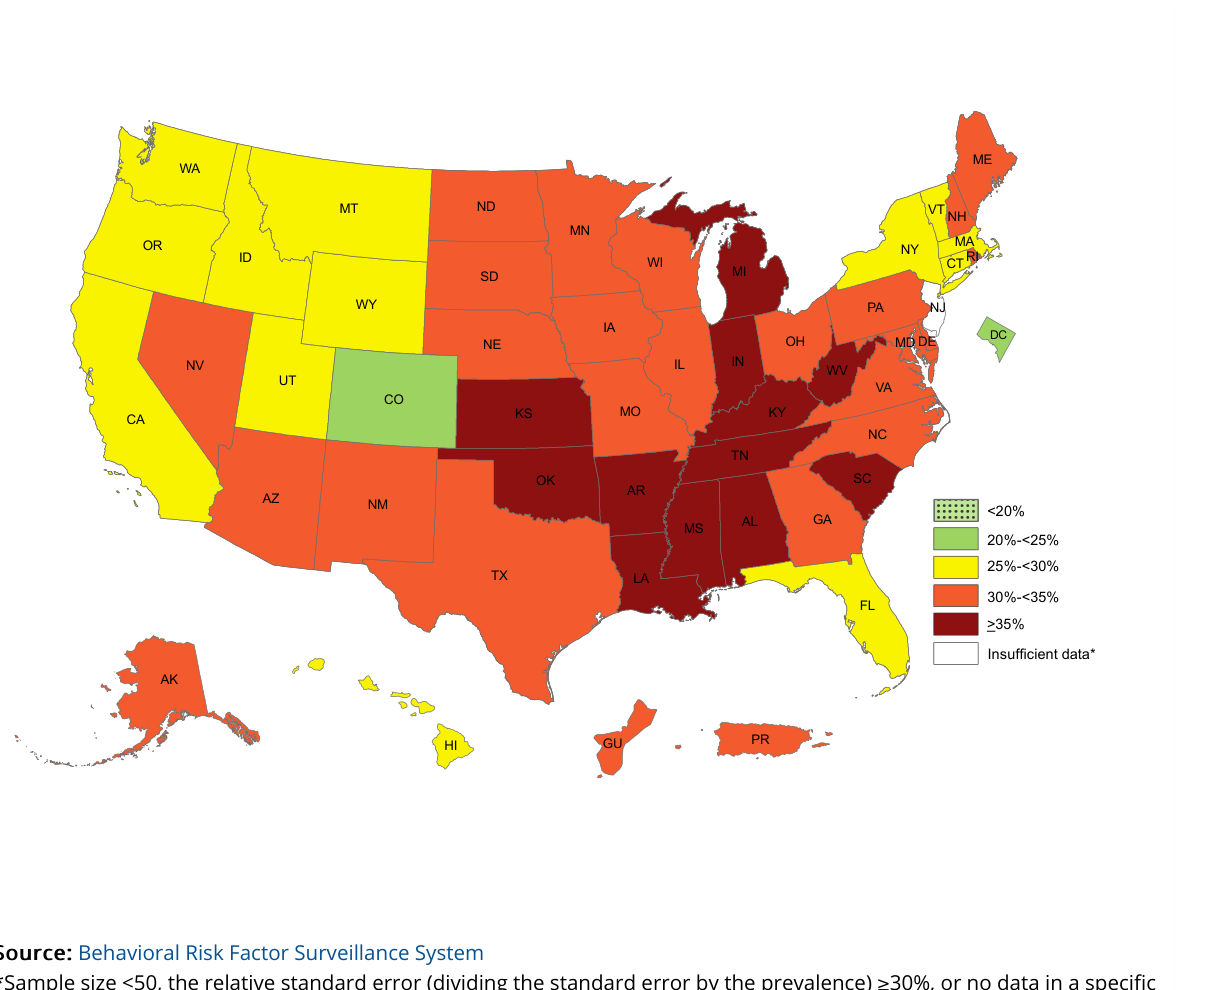
Source: U.S. CDC, Behavioral Risk Factor Surveillance System (public domain)
Expected output · excerpt
| CO | 20%-<25% | |||||||||||||||||||||||||||||||||||||||||||||||||||||||||||||||||||||||||||||||||||||||||||||||||
| CA | 25%-<30% | |||||||||||||||||||||||||||||||||||||||||||||||||||||||||||||||||||||||||||||||||||||||||||||||||
| TX | 30%-<35% | |||||||||||||||||||||||||||||||||||||||||||||||||||||||||||||||||||||||||||||||||||||||||||||||||
| MS | ≥35% | |||||||||||||||||||||||||||||||||||||||||||||||||||||||||||||||||||||||||||||||||||||||||||||||||
| … | ||||||||||||||||||||||||||||||||||||||||||||||||||||||||||||||||||||||||||||||||||||||||||||||||||
…
<table data-source="chart">
<tr> <td>CO</td> <td>20%-<25%</td> </tr>
<tr> <td>CA</td> <td>25%-<30%</td> </tr>
<tr> <td>TX</td> <td>30%-<35%</td> </tr>
<tr> <td>MS</td> <td>≥35%</td> </tr>
<!-- … -->
</table>
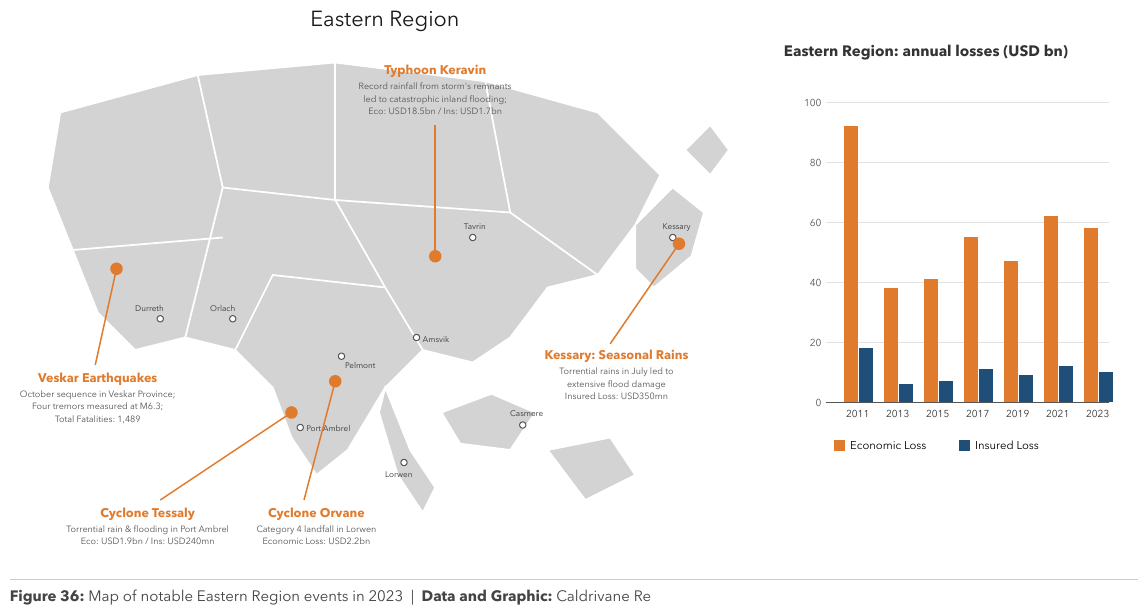
<!-- … -->Event pins over a regional mapregional-catastrophe-report-2023_p54
Event pins over a regional map, each callout naming an event and describing its losses
(Eco: USD1.9bn / Ins: USD240mn). The map's shading has no discrete legend to class regions
against, and a pin's position is not a value, so the map gives no chart table: its printed text is
transcribed as text. The data of this page is the loss chart beside the map, which is a chart
table like any other; its bars print no values, so they are estimates on the 20-unit grid. The
map's title, callouts and place names are elided.
Source page
Expected output · excerpt
…
| Economic Loss | Insured Loss | |
|---|---|---|
| 2011 | 92 | 18 |
| 2013 | 38 | 6 |
| 2015 | 41 | 7 |
| 2017 | 55 | 11 |
| 2019 | 47 | 9 |
| 2021 | 62 | 12 |
| 2023 | 58 | 10 |
Figure 36: Map of notable Eastern Region events in 2023 | Data and Graphic: Caldrivane Re
Neighbouring rules, and how they differ
More
Sample sources2 +
Public-domain U.S. federal government source material.
- U.S. Census Bureau, Apportionment of the U.S. House of Representatives Based on the 2020 Census
- U.S. CDC, Behavioral Risk Factor Surveillance System
Rule id charts-maps-and-treemaps · charts types