Dual-Axis and Combo Charts
Bars and lines on one canvas—which axis does each value read from?
✅ NormativeSettled. The requirement holds as written.📄 Page ruleCan be applied from the page alone.Read §11.2.2 in the RFC ↗
Bars and lines on one canvas, or a second value axis, change only how values are read: each
series' values MUST be copied or estimated against its own axis. The chart table is laid out
as usual — one row per x position, one column per series — and a series name MUST NOT gain its
mark type or axis side (no (line), no right axis).
When it applies
Before a value is estimated, the axis that scales its series is identified — from the legend order, the mark type and the magnitudes of each axis's tick labels — and the value is traced to that axis. A percentage series scaled by the right-hand axis read against the level axis on the left is a wrong value, however plausible it looks.
Reading the examples. Each one pairs a source page with the output the rule expects. ✅ Sample: the rule applies. ❌ Counter-sample: it looks like it applies and does not, or a rendering got it wrong. A non-conforming output, in red, is shown only for contrast. … marks content left out of an excerpt.
Examples
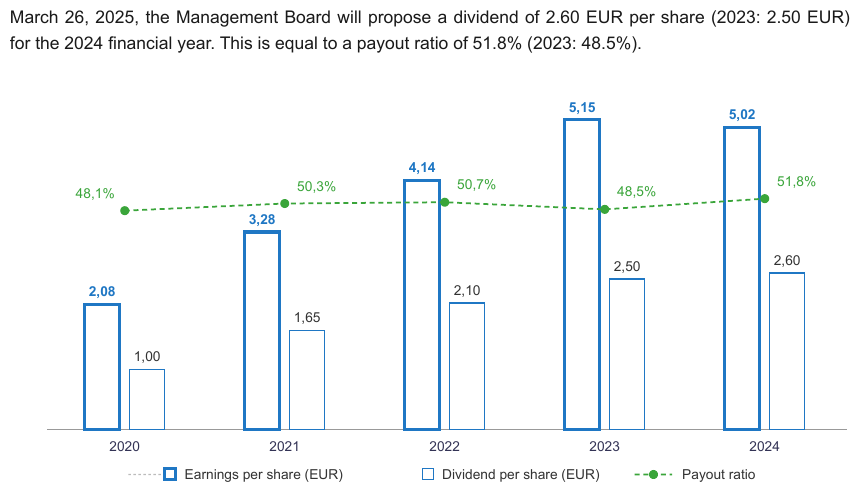
Two bar series in euros and a percentage line share one canvasindustrial-group-financial-report-2024_p15
no value axis is drawn, and every
mark prints its value, so every cell is copied rather than read. Full coverage is 15 values under
the legend entries, copied whole (Earnings per share (EUR) keeps the parenthesis printed inside
the legend). The chart prints decimal commas (2,08, 48,1%), and the cells keep them. The
earnings values are printed in bold.
Source page
Expected output
March 26, 2025, the Management Board will propose a dividend of 2.60 EUR per share (2023: 2.50 EUR) for the 2024 financial year. This is equal to a payout ratio of 51.8% (2023: 48.5%).
| Earnings per share (EUR) | Dividend per share (EUR) | Payout ratio | |
|---|---|---|---|
| 2020 | 2,08 | 1,00 | 48,1% |
| 2021 | 3,28 | 1,65 | 50,3% |
| 2022 | 4,14 | 2,10 | 50,7% |
| 2023 | 5,15 | 2,50 | 48,5% |
| 2024 | 5,02 | 2,60 | 51,8% |
Neighbouring rules, and how they differ
More
Rule id charts-dual-axis-and-combo-charts · charts types